TTC Performance: 48.2% Return (12 Months)
TTC returned 48.2% over 12 months, outperforming the S&P 500 (32.1%). Volatility: 29.4%.
| P/E Trailing | 27.8 |
| P/E Forward | 17.0 |
| 52 Week High | 101.33 USD |
| 52 Week Low | 62.27 USD |
| VRO Trend Strength ±100 | 34.74 |
| Buy Signal ±3 | 0.49 |
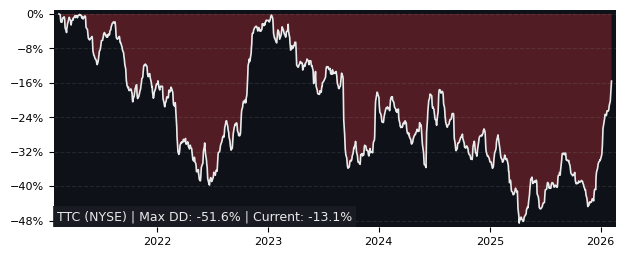
| Max Drawdown | 38.44% |
| Mean Drawdown | 17.49% |
Top Performer in Machinery (5/122)
| SYMBOL | 1W | 1M | 3M |
|---|---|---|---|
| CVGI | 33.86% | 180.00% | 163.58% |
| PL | -8.75% | 27.84% | 55.31% |
| NDX1 | 4.40% | 10.42% | 44.15% |
| ESE | 9.10% | 10.16% | 42.11% |
| TTC | 2.24% | -5.64% | 12.38% |
| AZ | 23.58% | 43.83% | 0.13% |
| SYMBOL | 6M | 12M | 5Y |
|---|---|---|---|
| PL | 141.28% | 813.02% | 211.72% |
| RKLB | 15.68% | 286.24% | 509.09% |
| CVGI | 146.82% | 277.88% | -55.93% |
| NVRI | 64.24% | 270.10% | 10.90% |
| NDX1 | 98.69% | 219.41% | 95.99% |
| TTC | 23.76% | 48.18% | -3.76% |
| SYMBOL | MCAP | 1M | 12M | 5Y | P/E | P/E fwd | PEG | EPS stab | EPS cagr |
|---|---|---|---|---|---|---|---|---|---|
| CAT NYSE Caterpillar |
336B | 5.92% | 161% | 243% | 38.2 | 32.4 | 2.0 | 60.8% | 16.8% |
| PLOW NYSE Douglas Dynamics |
967M | -2.17% | 94.5% | 10.1% | 21.4 | 18.3 | 1.22 | -4.40% | -21.1% |
| ESE NYSE ESCO Technologies |
7.57B | 10.2% | 106% | 170% | 60.6 | 25.4 | 1.67 | 74.8% | 28.0% |
| CMI NYSE Cummins |
76.0B | 2.37% | 104% | 142% | 26.8 | 21.2 | 1.51 | 31.9% | 1.49% |
| WAB NYSE Westinghouse Air Brake |
43.4B | 3.82% | 58.2% | 237% | 37.2 | 23.8 | 1.37 | 93.1% | 18.0% |
| PH NYSE Parker-Hannifin |
115B | -1.26% | 73.2% | 206% | 33.1 | 27.3 | 3.74 | -22.4% | -44.9% |
| ALSN NYSE Allison Transmission |
9.88B | 0.69% | 40.3% | 204% | 16.2 | 13.1 | 0.71 | -23.1% | -42.0% |
| MWA NYSE Mueller Water Products |
4.32B | -0.64% | 22.9% | 111% | 21.8 | 19.1 | 1.27 | 81.7% | 19.2% |
| WTS NYSE Watts Water Technologies |
9.63B | -5.95% | 58.6% | 155% | 28.4 | 24.9 | 3.12 | 76.5% | 13.5% |
| DOV NYSE Dover |
27.7B | -0.45% | 38.5% | 59.5% | 25.8 | 19.5 | 1.82 | 58.8% | 7.71% |
Performance: TTC vs S&P 500
| PERIOD | TTC | S&P 500 | DIFFERENCE |
|---|---|---|---|
| 1 Month | -5.64% | -1.73% | -3.98% |
| 3 Months | 12.38% | -4.49% | 17.66% |
| 6 Months | 23.76% | -1.33% | 25.43% |
| 12 Months | 48.18% | 32.14% | 12.14% |
| 5 Years | -3.76% | 72.70% | -44.27% |
TTC Performance FAQ
Does TTC outperform the market?
Yes, TTC significantly outperforms the market. Over the past 12 months, TTC returned 48.18% compared to 32.14% for the S&P 500.
What is the TTC return over the last 12 months?
TTC has returned 48.18% over the past 12 months, including dividends. Over 3 months the return was 12.38%, and over 5 years -3.76%.
How risky is TTC?
TTC has relatively low risk with a maximum drawdown of 38.44% over the past 3 years. The average drawdown is 17.49%.
TTC vs Sectors (12m)
Sorted by outperformance. Positive = TTC beats sector.
| SECTOR | ETF | DIFFERENCE 12M |
|---|---|---|
| Consumer Staples | XLP | 38.6% |
| Health Care | XLV | 37.5% |
| Real Estate | XLRE | 34.5% |
| Financials | XLF | 33.3% |
| Consumer Discretionary | XLY | 26.5% |
| Consumer Discretionary | XLY | 26.5% |
| Communication Services | XLC | 18.7% |
| Materials | XLB | 14.5% |
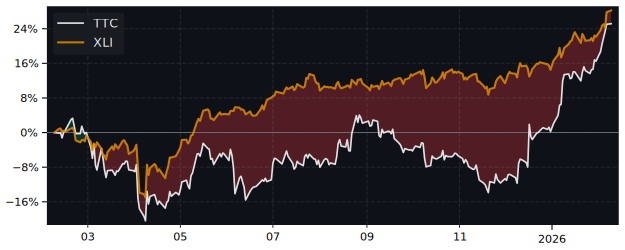
| Industrials | XLI | 6.1% |
| Technology | XLK | -1.8% |
| Energy | XLE | -9.3% |
TTC vs Asset Classes (12m)
| ASSET CLASS | ETF | DIFFERENCE 12M |
|---|---|---|
| S&P 500 | SPY | 12.14% |
| Gold | GLD | -8.1% |
| Long-Term Bonds | TLT | 47.6% |