(ASM) Avino Silver & Gold - Performance 254% in 12m
ASM performance: live returns, drawdowns, peer ranking & SPY comparison from 1w to 5y, all in one clean chart-driven dashboard.
Performance Rating
48.08%
#1 in Peer-Group
Rel. Strength
98.19%
#140 in Stock-Universe
Total Return 12m
254.04%
#1 in Peer-Group
Total Return 5y
321.69%
#1 in Peer-Group
| P/E | Value |
|---|---|
| P/E Trailing | 33.7 |
| P/E Forward | 18.6 |
| High / Low | USD |
|---|---|
| 52 Week High | 3.71 USD |
| 52 Week Low | 0.85 USD |
| Sentiment | Value |
|---|---|
| VRO Trend Strength +-100 | 45.60 |
| Buy/Sell Signal +-5 | 2.01 |
| Support / Resistance | Levels |
|---|---|
| Support | |
| Resistance |
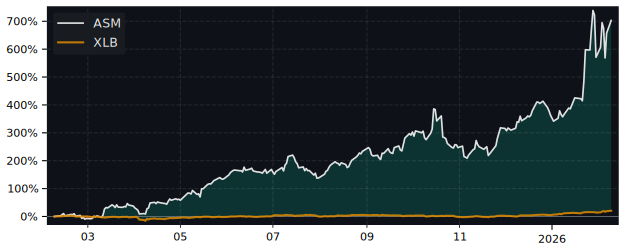
12m Total Return: ASM (254%) vs XLB (6.2%)
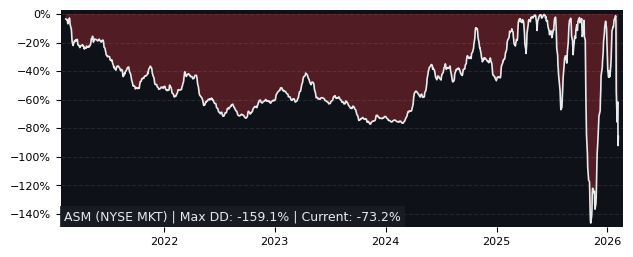
5y Drawdown (Underwater) Chart
Top Performer in Precious Metals & Minerals
Overall best picks of Peer Group - Selected by proven GARP Predictive Metrics, sorted by Growth Rating
| Symbol | 1m | 12m | 5y | P/E | P/E Forward | PEG | EPS Stability | EPS CAGR |
|---|
Performance Comparison: ASM vs XLB vs S&P 500
XLB (Materials Sector SPDR Fund ETF) is the Sector Benchmark for ASM
| Total Return (including Dividends) | ASM | XLB | S&P 500 |
|---|---|---|---|
| 1 Month | 1.45% | 4.67% | 5.22% |
| 3 Months | 113.41% | 10.54% | 16.86% |
| 12 Months | 254.04% | 6.16% | 14.81% |
| 5 Years | 321.69% | 72.93% | 111.83% |
| Trend Score (consistency of price movement) | ASM | XLB | S&P 500 |
|---|---|---|---|
| 1 Month | -41.2% | 33% | 81% |
| 3 Months | 93.9% | 93.7% | 96.9% |
| 12 Months | 83.1% | -54.7% | 44.9% |
| 5 Years | -5% | 76.1% | 84% |
| Relative Strength (compared with Indexes) | Rank in Peer Group | vs. XLB | vs. S&P 500 |
|---|---|---|---|
| 1 Month | %th12.50 | -3.07% | -3.58% |
| 3 Month | %th100.00 | 93.07% | 82.62% |
| 12 Month | %th100.00 | 233.48% | 208.36% |
| 5 Years | %th100.00 | 143.85% | 99.07% |
FAQs
Does Avino Silver & Gold (ASM) outperform the market?
Yes,
over the last 12 months ASM made 254.04%, while its related Sector, the Materials Sector SPDR Fund (XLB) made 6.16%.
Over the last 3 months ASM made 113.41%, while XLB made 10.54%.
Performance Comparison ASM vs Indeces and Sectors
Above 0 means better perfomance compared to Symbol in this Timeframe
ASM vs. Indices
| Symbol | 1w | 1m | 6m | 12m | |
|---|---|---|---|---|---|
| US S&P 500 | SPY | -5% | -3.8% | 263.9% | 239% |
| US NASDAQ 100 | QQQ | -4.6% | -4.2% | 262.7% | 240% |
| German DAX 40 | DAX | -4% | 2.1% | 250.5% | 225% |
| Shanghai Shenzhen CSI 300 | CSI 300 | -3.3% | -2.8% | 261.1% | 236% |
| Hongkong Hang Seng | HSI | -4% | -4.9% | 245.5% | 219% |
| India NIFTY 50 | INDA | -2.9% | -1.9% | 265.7% | 254% |
| Brasil Bovespa | EWZ | -7% | -6.8% | 237.2% | 243% |
ASM vs. Sectors
| Symbol | 1w | 1m | 6m | 12m | |
|---|---|---|---|---|---|
| Communication Services | XLC | -4.3% | -5.1% | 259.2% | 227% |
| Consumer Discretionary | XLY | -5.7% | -1.5% | 271.8% | 235% |
| Consumer Staples | XLP | -5.3% | 1.5% | 264% | 244% |
| Energy | XLE | -4.3% | -3.5% | 269.1% | 256% |
| Financial | XLF | -5.5% | -3% | 260% | 224% |
| Health Care | XLV | -3.7% | -0.9% | 271.9% | 258% |
| Industrial | XLI | -5.6% | -2.8% | 256.9% | 229% |
| Materials | XLB | -6.9% | -3.2% | 259.3% | 248% |
| Real Estate | XLRE | -4.8% | 0.2% | 266.3% | 241% |
| Technology | XLK | -5.1% | -7.4% | 260.8% | 243% |
| Utilities | XLU | -3.6% | 1.4% | 262.5% | 231% |
| Aerospace & Defense | XAR | -3.7% | -6.2% | 246.7% | 205% |
| Biotech | XBI | -4.6% | -2.1% | 278% | 260% |
| Homebuilder | XHB | -7.9% | -7.1% | 271.8% | 249% |
| Retail | XRT | -8% | -2.8% | 268.5% | 243% |
ASM vs. Commodities
| Symbol | 1w | 1m | 6m | 12m | |
|---|---|---|---|---|---|
| Oil | USO | -5% | -6.13% | 274% | 262% |
| Natural Gas | UNG | -0.2% | 11.5% | 272.4% | 261% |
| Gold | GLD | -2.9% | 2% | 244.1% | 213% |
| Silver | SLV | -3.3% | -5.1% | 246% | 234% |
| Copper | CPER | -3.4% | -3.6% | 245.3% | 240% |
ASM vs. Bonds
| Symbol | 1w | 1m | 6m | 12m | |
|---|---|---|---|---|---|
| iShares 20+ Years Bond | TLT | -2% | -1.2% | 268.4% | 255% |
| iShares High Yield Corp. Bond | HYG | -3.2% | -0.3% | 265.5% | 244% |