(LEU) Centrus Energy - Performance 313.5% in 12m
LEU performance: live returns, drawdowns, peer ranking & SPY comparison from 1w to 5y, all in one clean chart-driven dashboard.
Performance Rating
81.73%
#7 in Peer-Group
Rel. Strength
98.78%
#94 in Stock-Universe
Total Return 12m
313.45%
#1 in Peer-Group
Total Return 5y
1579.90%
#3 in Peer-Group
| P/E | Value |
|---|---|
| P/E Trailing | 25.1 |
| P/E Forward | 48.5 |
| High / Low | USD |
|---|---|
| 52 Week High | 173.03 USD |
| 52 Week Low | 35.36 USD |
| Sentiment | Value |
|---|---|
| VRO Trend Strength +-100 | 96.57 |
| Buy/Sell Signal +-5 | 0.10 |
| Support / Resistance | Levels |
|---|---|
| Support | 92.9, 86.2, 77.0, 66.2, 55.4 |
| Resistance |
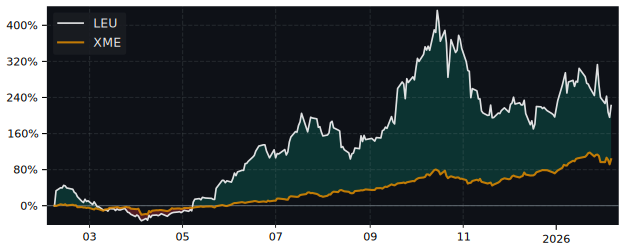
12m Total Return: LEU (313.5%) vs XLE (3.7%)
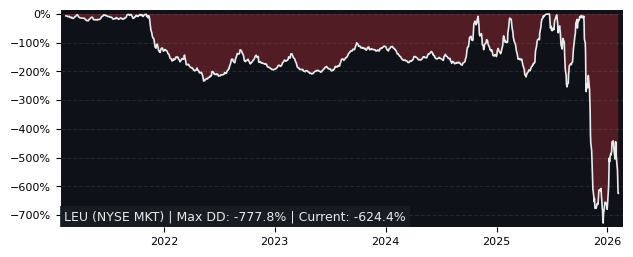
5y Drawdown (Underwater) Chart
Top Performer in Coal & Consumable Fuels
Overall best picks of Peer Group - Selected by proven GARP Predictive Metrics, sorted by Growth Rating
| Symbol | 1m | 12m | 5y | P/E | P/E Forward | PEG | EPS Stability | EPS CAGR |
|---|---|---|---|---|---|---|---|---|
| CCO TO Cameco |
29.6% | 34.5% | 573% | 145 | 66.7 | 1.94 | -23.3% | -43.8% |
Performance Comparison: LEU vs XLE vs S&P 500
XLE (Energy Sector SPDR Fund ETF) is the Sector Benchmark for LEU
| Total Return (including Dividends) | LEU | XLE | S&P 500 |
|---|---|---|---|
| 1 Month | 81.75% | 5.08% | 0.45% |
| 3 Months | 127.52% | -2.02% | 5.67% |
| 12 Months | 313.45% | 3.74% | 10.61% |
| 5 Years | 1579.90% | 175.33% | 107.31% |
| Trend Score (consistency of price movement) | LEU | XLE | S&P 500 |
|---|---|---|---|
| 1 Month | 96.2% | 59.9% | 79.9% |
| 3 Months | 83.7% | -6.3% | 74.7% |
| 12 Months | 69.5% | -29.1% | 43.2% |
| 5 Years | 79.5% | 92.9% | 84% |
| Relative Strength (compared with Indexes) | Rank in Peer Group | vs. XLE | vs. S&P 500 |
|---|---|---|---|
| 1 Month | #2 | 72.96% | 80.94% |
| 3 Month | #2 | 132.20% | 115.31% |
| 12 Month | #1 | 298.53% | 273.80% |
| 5 Years | #2 | 510.13% | 710.33% |
FAQs
Does Centrus Energy (LEU) outperform the market?
Yes,
over the last 12 months LEU made 313.45%, while its related Sector, the Energy Sector SPDR Fund (XLE) made 3.74%.
Over the last 3 months LEU made 127.52%, while XLE made -2.02%.
Performance Comparison LEU vs Indeces and Sectors
Above 0 means better perfomance compared to Symbol in this Timeframe
LEU vs. Indices
| Symbol | 1w | 1m | 6m | 12m | |
|---|---|---|---|---|---|
| US S&P 500 | SPY | 19.5% | 81.3% | 141.1% | 303% |
| US NASDAQ 100 | QQQ | 19.5% | 80.4% | 141.6% | 304% |
| German DAX 40 | DAX | 21% | 83.9% | 125.4% | 284% |
| Shanghai Shenzhen CSI 300 | CSI 300 | 18.6% | 82.1% | 141% | 302% |
| Hongkong Hang Seng | HSI | 18.9% | 77% | 122.3% | 286% |
| India NIFTY 50 | INDA | 21.2% | 83.5% | 142% | 315% |
| Brasil Bovespa | EWZ | 15.3% | 80.1% | 121.3% | 302% |
LEU vs. Sectors
| Symbol | 1w | 1m | 6m | 12m | |
|---|---|---|---|---|---|
| Communication Services | XLC | 19.8% | 80.2% | 137.2% | 290% |
| Consumer Discretionary | XLY | 21.4% | 84.9% | 152.4% | 297% |
| Consumer Staples | XLP | 20.1% | 83.9% | 140.5% | 307% |
| Energy | XLE | 14.4% | 76.7% | 136.6% | 310% |
| Financial | XLF | 20.2% | 84.4% | 137.5% | 289% |
| Health Care | XLV | 20.2% | 82.4% | 144% | 320% |
| Industrial | XLI | 19.7% | 82.9% | 135.2% | 295% |
| Materials | XLB | 20.5% | 81.8% | 140.4% | 314% |
| Real Estate | XLRE | 19.7% | 82.6% | 140.5% | 301% |
| Technology | XLK | 18.4% | 78.9% | 139.8% | 308% |
| Utilities | XLU | 19.2% | 84.4% | 134.3% | 294% |
| Aerospace & Defense | XAR | 18.3% | 76.9% | 123.6% | 271% |
| Biotech | XBI | 22.3% | 78.8% | 153.9% | 323% |
| Homebuilder | XHB | 23.6% | 88.4% | 157% | 324% |
| Retail | XRT | 22.1% | 81.8% | 147.7% | 312% |
LEU vs. Commodities
| Symbol | 1w | 1m | 6m | 12m | |
|---|---|---|---|---|---|
| Oil | USO | 3.6% | 61.6% | 128% | 308% |
| Natural Gas | UNG | 9.1% | 69.4% | 119.1% | 322% |
| Gold | GLD | 16.9% | 77.1% | 112.8% | 268% |
| Silver | SLV | 17.1% | 67.1% | 119.3% | 288% |
| Copper | CPER | 21% | 78.8% | 124.9% | 304% |
LEU vs. Bonds
| Symbol | 1w | 1m | 6m | 12m | |
|---|---|---|---|---|---|
| iShares 20+ Years Bond | TLT | 17.9% | 80.9% | 143.1% | 317% |
| iShares High Yield Corp. Bond | HYG | 18.7% | 81.2% | 137.7% | 304% |