(ONYX) Onyx Gold - Performance 637.5% in 12m
ONYX performance: live returns, drawdowns, peer ranking & SPY comparison from 1w to 5y, all in one clean chart-driven dashboard.
Performance Rating
42.74%
#51 in Peer-Group
Rel. Strength
99.65%
#28 in Stock-Universe
Total Return 12m
637.50%
#1 in Peer-Group
Total Return 5y
353.85%
#9 in Peer-Group
| P/E | Value |
|---|---|
| P/E Trailing | - |
| P/E Forward | - |
| High / Low | CAD |
|---|---|
| 52 Week High | 2.40 CAD |
| 52 Week Low | 0.16 CAD |
| Sentiment | Value |
|---|---|
| VRO Trend Strength +-100 | 86.66 |
| Buy/Sell Signal +-5 | 1.19 |
| Support / Resistance | Levels |
|---|---|
| Support | |
| Resistance |
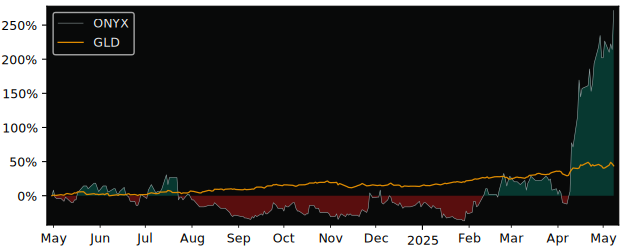
12m Total Return: ONYX (637.5%) vs GLD (37%)
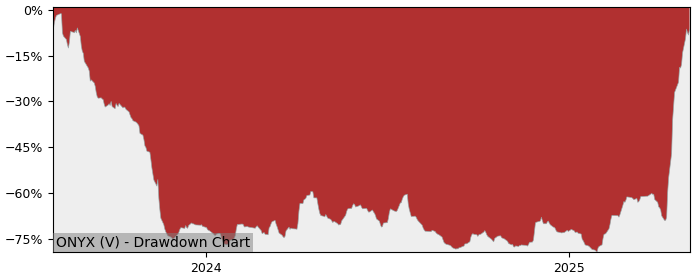
5y Drawdown (Underwater) Chart
Top Performer in Gold
Overall best picks of Peer Group - Selected by proven GARP Predictive Metrics, sorted by Growth Rating
| Symbol | 1m | 12m | 5y | P/E | P/E Forward | PEG | EPS Stability | EPS CAGR |
|---|---|---|---|---|---|---|---|---|
| PRU TO Perseus Mining |
-4.52% | 32.7% | 163% | 8.69 | 14.9 | 0.16 | 93.1% | 81% |
| DPM TO Dundee Precious Metals |
6.2% | 89.4% | 177% | 12.1 | 9.63 | 0.2 | 7.50% | -8.07% |
| TXG TO Torex Gold Resources |
-6.49% | 91.4% | 105% | 21.5 | 7.79 | 0.12 | -51.5% | -24.9% |
| ELD TO Eldorado Gold |
-3.22% | 22.9% | 82.9% | 12.7 | 13.4 | 0.63 | 43.7% | 37.2% |
| RGLD NASDAQ Royal Gold |
-12% | 16.7% | 29% | 29.8 | 20.8 | 1.41 | 37.4% | 8.68% |
| BVN NYSE Compania de Minas |
-0.97% | -3.36% | 83.8% | 10 | - | 0.27 | -12.6% | -3.51% |
| CG TO Centerra Gold |
2.27% | 18.1% | 25% | 41.2 | 9.89 | 0.49 | -39.1% | -20.2% |
| NEM NYSE Newmont Goldcorp |
-1.32% | 23.8% | 7.2% | 13.7 | 9.68 | 0.79 | 27.3% | 20% |
Performance Comparison: ONYX vs GLD vs S&P 500
GLD (SPDR Gold Shares ETF) is the Sector Benchmark for ONYX
| Total Return (including Dividends) | ONYX | GLD | S&P 500 |
|---|---|---|---|
| 1 Month | 132.51% | -1.62% | 3.54% |
| 3 Months | 257.58% | 3.01% | 16.07% |
| 12 Months | 637.50% | 37.04% | 12.18% |
| 5 Years | 353.85% | 80.30% | 107.69% |
| Trend Score (consistency of price movement) | ONYX | GLD | S&P 500 |
|---|---|---|---|
| 1 Month | 92.3% | -54.4% | 91.9% |
| 3 Months | 77.5% | 26.9% | 97.5% |
| 12 Months | 74% | 94.4% | 47% |
| 5 Years | 5.6% | 73.9% | 84% |
| Relative Strength (compared with Indexes) | Rank in Peer Group | vs. GLD | vs. S&P 500 |
|---|---|---|---|
| 1 Month | %th99.48 | 136.34% | 124.57% |
| 3 Month | %th99.48 | 247.14% | 208.08% |
| 12 Month | %th99.48 | 438.18% | 557.45% |
| 5 Years | %th95.81 | 168.40% | 222.74% |
FAQs
Does Onyx Gold (ONYX) outperform the market?
Yes,
over the last 12 months ONYX made 637.50%, while its related Sector, the SPDR Gold Shares (GLD) made 37.04%.
Over the last 3 months ONYX made 257.58%, while GLD made 3.01%.
Performance Comparison ONYX vs Indeces and Sectors
Above 0 means better perfomance compared to Symbol in this Timeframe
ONYX vs. Indices
| Symbol | 1w | 1m | 6m | 12m | |
|---|---|---|---|---|---|
| US S&P 500 | SPY | 7.5% | 129% | 1205.5% | 625% |
| US NASDAQ 100 | QQQ | 7% | 128.2% | 1203.1% | 625% |
| German DAX 40 | DAX | 8.4% | 131% | 1194.8% | 609% |
| Shanghai Shenzhen CSI 300 | CSI 300 | 6.9% | 127.6% | 1201.5% | 618% |
| Hongkong Hang Seng | HSI | 6.9% | 130.1% | 1183.5% | 603% |
| India NIFTY 50 | INDA | 9.2% | 131.9% | 1204.1% | 641% |
| Brasil Bovespa | EWZ | 12.1% | 135.5% | 1193.4% | 637% |
ONYX vs. Sectors
| Symbol | 1w | 1m | 6m | 12m | |
|---|---|---|---|---|---|
| Communication Services | XLC | 8.5% | 130.7% | 1201.4% | 614% |
| Consumer Discretionary | XLY | 7.1% | 129.9% | 1214.3% | 622% |
| Consumer Staples | XLP | 9.3% | 133.3% | 1204.8% | 631% |
| Energy | XLE | 9.6% | 132.8% | 1215.8% | 640% |
| Financial | XLF | 8.8% | 129.9% | 1206% | 616% |
| Health Care | XLV | 9.5% | 134.3% | 1216% | 646% |
| Industrial | XLI | 7.1% | 127.8% | 1199.7% | 616% |
| Materials | XLB | 10.1% | 130.8% | 1207.7% | 637% |
| Real Estate | XLRE | 8% | 133.1% | 1206.7% | 631% |
| Technology | XLK | 7.1% | 126.2% | 1199.7% | 627% |
| Utilities | XLU | 6.7% | 130.6% | 1202.8% | 616% |
| Aerospace & Defense | XAR | 4.6% | 123.3% | 1185% | 589% |
| Biotech | XBI | 6.3% | 129.5% | 1214.1% | 651% |
| Homebuilder | XHB | 9.2% | 127% | 1218.9% | 644% |
| Retail | XRT | 8.7% | 129.6% | 1209.7% | 633% |
ONYX vs. Commodities
| Symbol | 1w | 1m | 6m | 12m | |
|---|---|---|---|---|---|
| Oil | USO | 10% | 137% | 1,222% | 644% |
| Natural Gas | UNG | 3% | 141% | 1229.8% | 630% |
| Gold | GLD | 6.9% | 134.1% | 1187.9% | 600% |
| Silver | SLV | 4.9% | 128.8% | 1188.6% | 615% |
| Copper | CPER | 6.2% | 118.9% | 1186.8% | 615% |
ONYX vs. Bonds
| Symbol | 1w | 1m | 6m | 12m | |
|---|---|---|---|---|---|
| iShares 20+ Years Bond | TLT | 9% | 132.7% | 1211% | 642% |
| iShares High Yield Corp. Bond | HYG | 7.9% | 131.6% | 1207.5% | 629% |