(VRL) Net Digital - Performance 171.9% in 12m
VRL performance: live returns, drawdowns, peer ranking & SPY comparison from 1w to 5y, all in one clean chart-driven dashboard.
Performance Rating
8.64%
#26 in Peer-Group
Rel. Strength
96.77%
#250 in Stock-Universe
Total Return 12m
171.87%
#2 in Peer-Group
Total Return 5y
178.85%
#7 in Peer-Group
| P/E | Value |
|---|---|
| P/E Trailing | - |
| P/E Forward | 21.5 |
| High / Low | EUR |
|---|---|
| 52 Week High | 8.70 EUR |
| 52 Week Low | 2.78 EUR |
| Sentiment | Value |
|---|---|
| VRO Trend Strength +-100 | 99.03 |
| Buy/Sell Signal +-5 | 2.89 |
| Support / Resistance | Levels |
|---|---|
| Support | |
| Resistance |
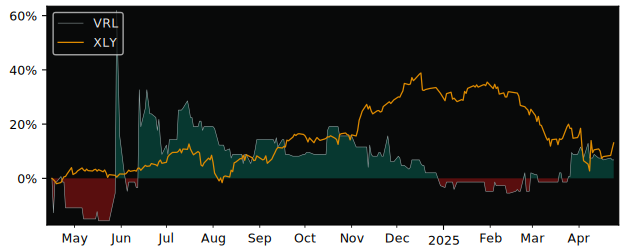
12m Total Return: VRL (171.9%) vs EXS1 (30.3%)
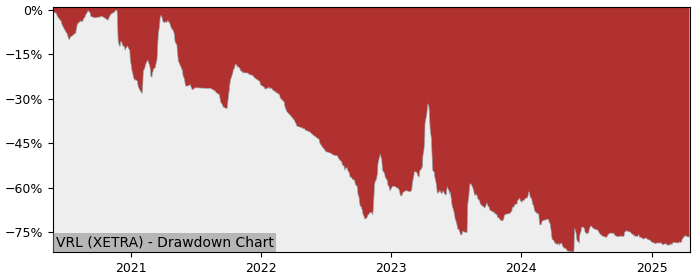
5y Drawdown (Underwater) Chart
Top Performer in Internet & Direct Marketing Retail
Overall best picks of Peer Group - Selected by proven GARP Predictive Metrics, sorted by Growth Rating
| Symbol | 1m | 12m | 5y | P/E | P/E Forward | PEG | EPS Stability | EPS CAGR |
|---|---|---|---|---|---|---|---|---|
| 690D XETRA Haier Smart Home |
-1.54% | 27.6% | 259% | 7.4 | 7.07 | 0.89 | 61.3% | 9.53% |
| ZAL XETRA Zalando SE |
-12.2% | 25.2% | -57.4% | 27.4 | 26.2 | 0.53 | -22.2% | -44.8% |
| ALE WAR Allegro.eu S.A. |
-2.98% | -6.28% | -51.2% | 32.5 | 23.9 | 0.38 | - | - |
| TMV XETRA TeamViewer |
-8.66% | -13.5% | -81.7% | 12.3 | 10.3 | 0.52 | 76.8% | 28.4% |
Performance Comparison: VRL vs EXS1 vs S&P 500
EXS1 (iShares Core DAX (DE) ETF) is the Sector Benchmark for VRL
| Total Return (including Dividends) | VRL | EXS1 | S&P 500 |
|---|---|---|---|
| 1 Month | 41.46% | -0.56% | 4.99% |
| 3 Months | 165.24% | 5.92% | 10.23% |
| 12 Months | 171.87% | 30.33% | 14.42% |
| 5 Years | 178.85% | 81.41% | 110.17% |
| Trend Score (consistency of price movement) | VRL | EXS1 | S&P 500 |
|---|---|---|---|
| 1 Month | 73% | -45.6% | 79.1% |
| 3 Months | 89.6% | 67.6% | 95.5% |
| 12 Months | -2.4% | 95.1% | 44.7% |
| 5 Years | -68.4% | 79.1% | 84% |
| Relative Strength (compared with Indexes) | Rank in Peer Group | vs. EXS1 | vs. S&P 500 |
|---|---|---|---|
| 1 Month | %th98.28 | 42.27% | 34.74% |
| 3 Month | %th100.00 | 150.42% | 140.62% |
| 12 Month | %th96.55 | 108.61% | 137.61% |
| 5 Years | %th87.93 | 53.71% | 32.67% |
FAQs
Does Net Digital (VRL) outperform the market?
Yes,
over the last 12 months VRL made 171.87%, while its related Sector, the iShares Core DAX (DE) (EXS1) made 30.33%.
Over the last 3 months VRL made 165.24%, while EXS1 made 5.92%.
Performance Comparison VRL vs Indeces and Sectors
Above 0 means better perfomance compared to Symbol in this Timeframe
VRL vs. Indices
| Symbol | 1w | 1m | 6m | 12m | |
|---|---|---|---|---|---|
| US S&P 500 | SPY | 39.3% | 36.5% | 199.6% | 157% |
| US NASDAQ 100 | QQQ | 39.7% | 36.1% | 198.1% | 158% |
| German DAX 40 | DAX | 40.2% | 42% | 188% | 142% |
| Shanghai Shenzhen CSI 300 | CSI 300 | 42% | 37.3% | 199.1% | 154% |
| Hongkong Hang Seng | HSI | 41.2% | 34.3% | 181.1% | 135% |
| India NIFTY 50 | INDA | 40.4% | 39.5% | 202.2% | 172% |
| Brasil Bovespa | EWZ | 36.6% | 33.5% | 176.7% | 158% |
VRL vs. Sectors
| Symbol | 1w | 1m | 6m | 12m | |
|---|---|---|---|---|---|
| Communication Services | XLC | 39.3% | 35.8% | 195.3% | 146% |
| Consumer Discretionary | XLY | 38.2% | 38.6% | 206.5% | 153% |
| Consumer Staples | XLP | 39% | 41.6% | 200.2% | 162% |
| Energy | XLE | 38.6% | 35.4% | 204.4% | 173% |
| Financial | XLF | 39.1% | 37.9% | 196.4% | 144% |
| Health Care | XLV | 40.4% | 39% | 207.1% | 177% |
| Industrial | XLI | 38.4% | 37.3% | 192.8% | 148% |
| Materials | XLB | 36.2% | 35.7% | 195.4% | 165% |
| Real Estate | XLRE | 40.1% | 40.6% | 201% | 159% |
| Technology | XLK | 39.8% | 32.4% | 196.6% | 160% |
| Utilities | XLU | 40.6% | 41.9% | 198.3% | 149% |
| Aerospace & Defense | XAR | 39.1% | 33.9% | 181.3% | 124% |
| Biotech | XBI | 39.6% | 37.1% | 213.7% | 179% |
| Homebuilder | XHB | 34.4% | 29.8% | 205.6% | 166% |
| Retail | XRT | 36.6% | 36% | 204.8% | 162% |
VRL vs. Commodities
| Symbol | 1w | 1m | 6m | 12m | |
|---|---|---|---|---|---|
| Oil | USO | 38.4% | 32.8% | 208% | 179% |
| Natural Gas | UNG | 44.2% | 50.1% | 215.7% | 178% |
| Gold | GLD | 40.8% | 42.2% | 180.3% | 128% |
| Silver | SLV | 40.8% | 36.2% | 182.9% | 149% |
| Copper | CPER | 37% | 35.3% | 179% | 155% |
VRL vs. Bonds
| Symbol | 1w | 1m | 6m | 12m | |
|---|---|---|---|---|---|
| iShares 20+ Years Bond | TLT | 41% | 38.2% | 204.2% | 171% |
| iShares High Yield Corp. Bond | HYG | 40.8% | 39.5% | 201.5% | 161% |