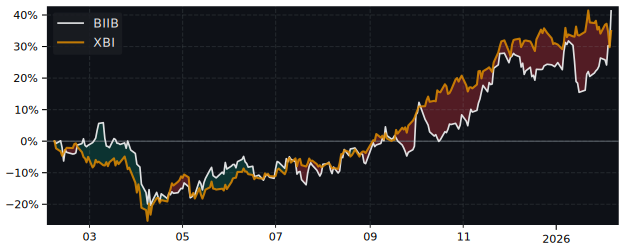
BIIB Performance: 44.6% Return (12 Months)
BIIB returned 44.6% over 12 months, outperforming the S&P 500 (32.1%). Volatility: 31.0%.
| P/E Trailing | 20.2 |
| P/E Forward | 12.0 |
| 52 Week High | 201.18 USD |
| 52 Week Low | 113.38 USD |
| VRO Trend Strength ±100 | 9.06 |
| Buy Signal ±3 | -0.42 |
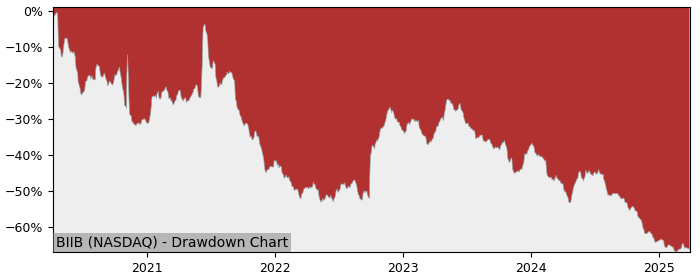
| Max Drawdown | 64.35% |
| Mean Drawdown | 37.30% |
Top Performer in Biotechnology (5/200)
| SYMBOL | 1W | 1M | 3M |
|---|---|---|---|
| ERAS | 14.59% | 10.67% | 371.63% |
| DNTH | 7.61% | 31.13% | 136.19% |
| ORKA | 23.84% | 70.97% | 111.76% |
| CNTA | 43.84% | 52.87% | 74.91% |
| KOD | 15.86% | 56.88% | 55.69% |
| BIIB | -8.12% | -6.78% | -5.62% |
| SYMBOL | 6M | 12M | 5Y |
|---|---|---|---|
| ABVX | 37.84% | 2184.32% | 929.91% |
| ABVX | 33.07% | 1990.72% | 407.51% |
| KOD | 166.21% | 1688.99% | -64.63% |
| TNGX | 167.68% | 1497.64% | 78.77% |
| ERAS | 634.76% | 1297.55% | -1.78% |
| BIIB | 11.87% | 44.59% | -35.14% |
| SYMBOL | MCAP | 1M | 12M | 5Y | P/E | P/E fwd | PEG | EPS stab | EPS cagr |
|---|---|---|---|---|---|---|---|---|---|
| ROIV NASDAQ Roivant Sciences |
20.3B | -3.13% | 201% | 184% | - | - | - | 37.2% | -14.4% |
| UTHR NASDAQ United Therapeutics |
24.8B | 17.0% | 91.8% | 179% | 20.3 | 20.0 | 2.25 | -2.20% | -35.9% |
| DAWN NASDAQ Day One Biopharmaceuticals |
2.22B | 1.23% | 206% | -17.1% | - | - | - | 57.3% | 49.0% |
| FOLD NASDAQ Amicus Therapeutics |
4.53B | 0.77% | 102% | 55.9% | - | 30.5 | -0.18 | 83.6% | 131% |
| GLUE NASDAQ Monte Rosa Therapeutics |
1.37B | -4.89% | 318% | -20.1% | - | 10.9 | - | 59.8% | 43.8% |
| MIRM NASDAQ Mirum Pharmaceuticals |
5.68B | 11.5% | 135% | 403% | - | - | - | 84.0% | 24.5% |
| KRYS NASDAQ Krystal Biotech |
7.57B | 3.20% | 57.7% | 254% | 37.9 | 44.8 | - | 84.4% | 26.5% |
| AUPH NASDAQ Aurinia Pharmaceuticals |
2.08B | 11.7% | 111% | 23.5% | 7.54 | 22.7 | - | 63.8% | 123% |
| STRO NASDAQ Sutro Biopharma |
394M | -5.30% | 234% | -88.7% | - | 8.96 | - | -29.4% | -68.0% |
| PHARM AS Pharming |
1.17B | 7.74% | 102% | 28.1% | - | 100 | - | -4.20% | - |
Performance: BIIB vs S&P 500
| PERIOD | BIIB | S&P 500 | DIFFERENCE |
|---|---|---|---|
| 1 Month | -6.78% | -1.73% | -5.13% |
| 3 Months | -5.62% | -4.49% | -1.18% |
| 6 Months | 11.87% | -1.33% | 13.38% |
| 12 Months | 44.59% | 32.14% | 9.42% |
| 5 Years | -35.14% | 72.70% | -62.45% |
BIIB Performance FAQ
Does BIIB outperform the market?
Yes, BIIB significantly outperforms the market. Over the past 12 months, BIIB returned 44.59% compared to 32.14% for the S&P 500.
What is the BIIB return over the last 12 months?
BIIB has returned 44.59% over the past 12 months, including dividends. Over 3 months the return was -5.62%, and over 5 years -35.14%.
How risky is BIIB?
BIIB has relatively low risk with a maximum drawdown of 64.35% over the past 3 years. The average drawdown is 37.30%.
BIIB vs Sectors (12m)
Sorted by outperformance. Positive = BIIB beats sector.
| SECTOR | ETF | DIFFERENCE 12M |
|---|---|---|
| Consumer Staples | XLP | 35.1% |
| Health Care | XLV | 33.9% |
| Real Estate | XLRE | 30.9% |
| Financials | XLF | 29.7% |
| Consumer Discretionary | XLY | 22.9% |
| Consumer Discretionary | XLY | 22.9% |
| Communication Services | XLC | 15.1% |
| Materials | XLB | 11% |
| Industrials | XLI | 2.5% |
| Technology | XLK | -5.4% |
| Energy | XLE | -12.8% |
BIIB vs Asset Classes (12m)
| ASSET CLASS | ETF | DIFFERENCE 12M |
|---|---|---|
| S&P 500 | SPY | 9.42% |
| Gold | GLD | -11.7% |
| Long-Term Bonds | TLT | 44% |