IESC Performance Analysis - IES Holdings | 101.8% 12M Return
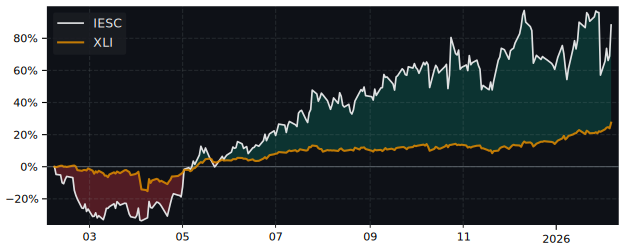
12M Return: 101.8% | +80.1% vs S&P 500 | Volatility: 75.4% | Relative Strength, Momentum & Peer Ranking
Detailed Performance Metrics Updated: 2026-07-15 03:55
| CAGR | 121.5% |
| CAGR / Max DD | 2.47 |
| CAGR / Mean DD | 10.66 |
| CAGR / Median DD | 15.90 |
| ATR % | 7.54% |
| Beta | 2.259 |
| Beta Downside | 1.579 |
| Alpha | 55.19% |
| CAPM | 13.93% |
| Current Price | 616.15 USD |
| SMA 20 Distance | +8.25% |
| SMA 50 Distance | +11.35% |
| SMA 200 Distance | -18.01% |
| RSI 14 | 41.4 |
| EMA8 Dist. Percentile | 18.0% |
| Distance to 52W High | -23.36% |
| Hurst Exponent | 0.435 |
-
| METRIC | IESC | PERCENTILE RANK |
|---|---|---|
| RS IBD | 89.21 | 79.3 |
| Performance 1M | -15.18% | 12.0 |
| Performance 3M | 13.23% | 75.0 |
| Performance 6M | 46.80% | 75.0 |
| Performance 12M | 101.75% | 77.2 |
| Sharpe Ratio | 1.34 | 64.1 |
Top Performer in Construction & Engineering 5 of 46 peers
| SYMBOL | 1W | 1M | 3M |
|---|---|---|---|
| NWPX | 2.07% | 5.42% | 57.76% |
| WSC | 4.56% | -5.16% | 40.98% |
| CDNL | -8.08% | -2.37% | 40.06% |
| BBCP | -6.71% | -3.87% | 35.81% |
| ACA | 0.23% | 12.96% | 27.05% |
| IESC | 1.10% | -15.18% | 13.23% |
| SYMBOL | 6M | 12M | 5Y |
|---|---|---|---|
| FIX | 68.71% | 227.67% | 2405.88% |
| NWPX | 103.58% | 226.66% | 405.52% |
| AGX | 95.75% | 182.85% | 1427.07% |
| STRL | 112.87% | 181.64% | 3159.57% |
| CDNL | 166.51% | 175.46% | 175.46% |
| IESC | 46.80% | 101.75% | 1226.48% |
Overall Best Picks of Peer Group GARP Metrics
| SYMBOL | MCAP | 1M | 12M | 5Y | P/E | P/E fwd | PEG | EPS cagr |
|---|---|---|---|---|---|---|---|---|
| IESC NASDAQ IES Holdings |
12.5B | -15.18% | 101.75% | 1226.48% | 34.4 | 208 | 0.00 | 70.48% |
| STRL NASDAQ Sterling Construction |
20.9B | -21.58% | 181.64% | 3159.57% | 61.0 | 35.1 | 1.13 | 50.88% |
| VMI NYSE Valmont Industries |
10.6B | 0.66% | 64.38% | 156.50% | 30.0 | 23.5 | 1.23 | 9.88% |
| FIX NYSE Comfort Systems USA |
62.7B | -9.06% | 227.67% | 2405.88% | 48.5 | 38.6 | 0.81 | 78.01% |
| DY NYSE Dycom Industries |
12.8B | -11.12% | 65.15% | 554.59% | 40.7 | 31.2 | 3.50 | 22.39% |
| AGX NYSE Argan |
9.64B | -9.89% | 182.85% | 1427.07% | 58.5 | 16.6 | 0.00 | 88.16% |
Compare IESC vs S&P 500
| PERIOD | IESC | S&P 500 |
|---|---|---|
| 1 Week | 1.10% | 0.55% |
| 1 Month | -15.18% | -0.14% |
| 3 Months | 13.23% | 8.54% |
| 6 Months | 46.80% | 9.48% |
| 12 Months | 101.75% | 21.66% |
| 5 Years | 1226.48% | 89.29% |
FAQ
Yes, IESC significantly outperforms the market. Over the past 12 months, IESC returned 101.75% compared to 21.66% for the S&P 500.
IESC has returned 101.75% over the past 12 months, including dividends. Over 3 months the return was 13.23%, and over 5 years 1226.48%.
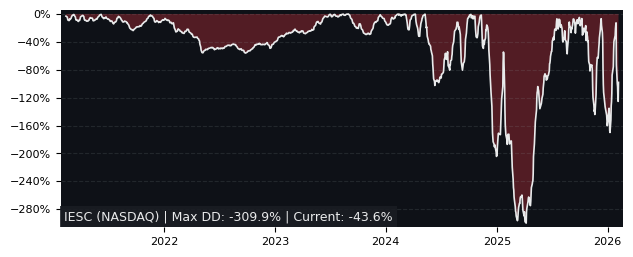
IESC has relatively low risk with a maximum drawdown of 49.23% over the past 3 years. The average drawdown is 11.40%.
IESC vs Sectors 12m
| SECTOR | ETF | DIFFERENCE 12M |
|---|---|---|
| Consumer Discretionary | XLY | 96.6% |
| Communication Services | XLC | 96.3% |
| Consumer Staples | XLP | 95.7% |
| Financials | XLF | 93.2% |
| Real Estate | XLRE | 91.8% |
| Materials | XLB | 88.4% |
| Materials | XLB | 88.4% |
| Health Care | XLV | 82.5% |
| Industrials | XLI | 80.7% |
| Energy | XLE | 68.5% |
| Technology | XLK | 57.3% |
IESC vs Asset Classes 12m
| ASSET CLASS | ETF | DIFFERENCE 12M |
|---|---|---|
| S&P 500 | SPY | 80.1% |
| Emerging Market | EEM | 63.2% |
| Gold | GLD | 80.9% |
| Long-Term Bonds | TLT | 99.1% |
| Risk-Free Cash | SHY | 98.7% |