KIDS Performance: -26.9% Return (12 Months)
KIDS returned -26.9% over 12 months, underperforming the S&P 500 (32.1%). Volatility: 48.2%.
| P/E Trailing | 0.00 |
| P/E Forward | 0.00 |
| 52 Week High | 23.68 USD |
| 52 Week Low | 15.20 USD |
| VRO Trend Strength ±100 | 37.15 |
| Buy Signal ±3 | -0.63 |
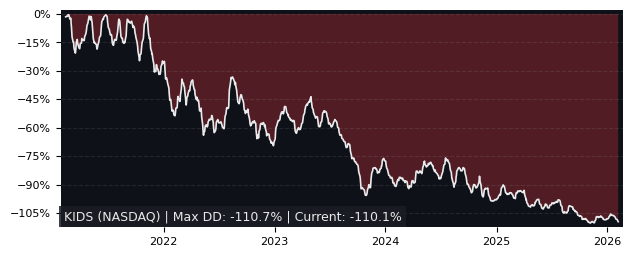
| Max Drawdown | 70.76% |
| Mean Drawdown | 47.37% |
Top Performer in Health Care Supplies (5/24)
| SYMBOL | 1W | 1M | 3M |
|---|---|---|---|
| NEOG | 7.30% | -1.44% | 29.01% |
| AVNS | 0.73% | 4.06% | 17.90% |
| LNTH | 3.83% | 4.59% | 8.91% |
| SENS | 8.25% | 12.25% | 6.19% |
| STAA | 14.29% | 13.54% | -5.95% |
| KIDS | 4.87% | -11.69% | -14.94% |
| SYMBOL | 6M | 12M | 5Y |
|---|---|---|---|
| FIGS | 90.61% | 250.79% | -55.36% |
| ESTA | 53.39% | 92.75% | -13.57% |
| CERS | 14.91% | 49.19% | -69.52% |
| NEOG | 69.80% | 21.78% | -78.92% |
| ALGN | 30.70% | 12.08% | -70.15% |
| KIDS | -12.61% | -26.88% | -67.82% |
| SYMBOL | MCAP | 1M | 12M | 5Y | P/E | P/E fwd | PEG | EPS stab | EPS cagr |
|---|---|---|---|---|---|---|---|---|---|
| FIGS NYSE Figs |
2.44B | -18.4% | 251% | -55.4% | 77.2 | 59.5 | - | 13.6% | 20.3% |
| ALGN NASDAQ Align Technology |
12.2B | -1.22% | 12.1% | -70.2% | 30.2 | 15.2 | 0.90 | -7.20% | -46.1% |
| BLCO NYSE Bausch + Lomb |
5.65B | -4.22% | 37.7% | -9.22% | - | 13.4 | 0.70 | -28.4% | 22.4% |
| LNTH NASDAQ Lantheus Holdings |
4.95B | 4.59% | -20.5% | 258% | 22.3 | 14.1 | 0.61 | -13.9% | -40.0% |
| COO NASDAQ The Cooper Companies |
13.9B | -8.18% | -4.12% | -26.2% | 35.5 | 15.9 | 1.86 | -79.0% | -25.0% |
Performance: KIDS vs S&P 500
| PERIOD | KIDS | S&P 500 | DIFFERENCE |
|---|---|---|---|
| 1 Month | -11.69% | -1.73% | -10.13% |
| 3 Months | -14.94% | -4.49% | -10.94% |
| 6 Months | -12.61% | -1.33% | -11.43% |
| 12 Months | -26.88% | 32.14% | -44.67% |
| 5 Years | -67.82% | 72.70% | -81.37% |
KIDS Performance FAQ
Does KIDS outperform the market?
No, KIDS underperforms the market. Over the past 12 months, KIDS returned -26.88% compared to 32.14% for the S&P 500.
What is the KIDS return over the last 12 months?
KIDS has returned -26.88% over the past 12 months, including dividends. Over 3 months the return was -14.94%, and over 5 years -67.82%.
How risky is KIDS?
KIDS has relatively low risk with a maximum drawdown of 70.76% over the past 3 years. The average drawdown is 47.37%.
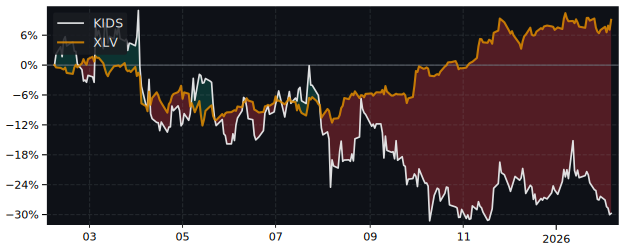
KIDS vs Sectors (12m)
Sorted by outperformance. Positive = KIDS beats sector.
| SECTOR | ETF | DIFFERENCE 12M |
|---|---|---|
| Consumer Staples | XLP | -36.4% |
| Health Care | XLV | -37.6% |
| Real Estate | XLRE | -40.5% |
| Financials | XLF | -41.8% |
| Consumer Discretionary | XLY | -48.6% |
| Consumer Discretionary | XLY | -48.6% |
| Communication Services | XLC | -56.4% |
| Materials | XLB | -60.5% |
| Industrials | XLI | -69% |
| Technology | XLK | -76.8% |
| Energy | XLE | -84.3% |
KIDS vs Asset Classes (12m)
| ASSET CLASS | ETF | DIFFERENCE 12M |
|---|---|---|
| S&P 500 | SPY | -44.67% |
| Gold | GLD | -83.1% |
| Long-Term Bonds | TLT | -27.5% |