MRCY Performance Analysis - Mercury Systems | 110.6% 12M Return
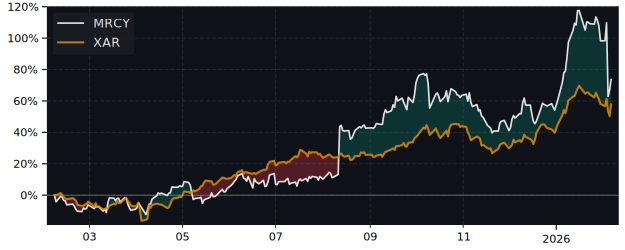
12M Return: 110.6% | +88.4% vs S&P 500 | Volatility: 51.3% | Relative Strength, Momentum & Peer Ranking
Detailed Performance Metrics Updated: 2026-07-13 03:55
| CAGR | 47.0% |
| CAGR / Max DD | 1.34 |
| CAGR / Mean DD | 3.91 |
| CAGR / Median DD | 4.58 |
| ATR % | 5.63% |
| Beta | 1.543 |
| Beta Downside | 0.932 |
| Alpha | 73.95% |
| CAPM | 11.41% |
| Current Price | 107.98 USD |
| SMA 20 Distance | +4.98% |
| SMA 50 Distance | -3.57% |
| SMA 200 Distance | -20.11% |
| RSI 14 | 46.1 |
| EMA8 Dist. Percentile | 1.4% |
| Distance to 52W High | -15.52% |
| Hurst Exponent | 0.547 |
| METRIC | MRCY | PERCENTILE RANK |
|---|---|---|
| RS IBD | 88.58 | 94.1 |
| Performance 1M | -10.24% | 17.8 |
| Performance 3M | 30.85% | 95.8 |
| Performance 6M | 11.30% | 80.5 |
| Performance 12M | 110.61% | 95.8 |
| Sharpe Ratio | 1.52 | 90.7 |
Top Performer in Aerospace & Defense 5 of 59 peers
| SYMBOL | 1W | 1M | 3M |
|---|---|---|---|
| AXON | -5.23% | 28.09% | 57.33% |
| MILDEF | -6.64% | -6.56% | 40.40% |
| MRCY | -14.44% | -10.24% | 30.85% |
| AIR | -4.31% | 10.03% | 17.86% |
| MTX | -4.36% | 16.06% | 12.76% |
| EXA | 1.14% | 23.16% | -3.28% |
| SYMBOL | 6M | 12M | 5Y |
|---|---|---|---|
| ATRO | 29.83% | 153.89% | 383.46% |
| PKE | 41.65% | 115.86% | 169.26% |
| MRCY | 11.30% | 110.61% | 62.18% |
| DCO | 51.08% | 86.58% | 210.59% |
| AIR | 38.11% | 81.57% | 268.27% |
| HXL | 21.21% | 68.98% | 73.93% |
Overall Best Picks of Peer Group GARP Metrics
| SYMBOL | MCAP | 1M | 12M | 5Y | P/E | P/E fwd | PEG | EPS cagr |
|---|---|---|---|---|---|---|---|---|
| ATRO NASDAQ Astronics |
3.58B | -5.37% | 153.89% | 383.46% | 71.8 | 27.2 | 1.46 | -% |
| HWM NYSE Howmet Aerospace |
108B | 2.33% | 47.28% | 737.91% | 62.8 | 52.6 | 0.80 | 42.98% |
| PKE NYSE Park Aerospace |
758M | -5.33% | 115.86% | 169.26% | 66.0 | 17.1 | 1.49 | 0.12% |
| CW NYSE Curtiss-Wright |
28.1B | -0.39% | 55.18% | 550.46% | 55.9 | 28.4 | 2.00 | 18.53% |
| GE NYSE GE Aerospace |
375B | 7.28% | 37.64% | 472.75% | 44.3 | 48.1 | 8.57 | 44.89% |
| ACLN SW Accelleron Industries |
9.71B | 2.26% | 36.56% | 383.97% | 41.8 | 20.8 | - | -% |
| HEI NYSE Heico |
50.6B | 5.86% | 9.20% | 157.56% | 64.5 | 51.8 | 2.78 | 29.05% |
| BS6 SG YANGZIJIANG SHIPBLDG HLDGS |
10.8B | 4.64% | 64.58% | 500.77% | 8.48 | 7.50 | 1.83 | -% |
Compare MRCY vs S&P 500
| PERIOD | MRCY | S&P 500 |
|---|---|---|
| 1 Week | -14.44% | 1.37% |
| 1 Month | -10.24% | 2.04% |
| 3 Months | 30.85% | 10.32% |
| 6 Months | 11.30% | 9.18% |
| 12 Months | 110.61% | 22.17% |
| 5 Years | 62.18% | 85.44% |
FAQ
Yes, MRCY significantly outperforms the market. Over the past 12 months, MRCY returned 110.61% compared to 22.17% for the S&P 500.
MRCY has returned 110.61% over the past 12 months, including dividends. Over 3 months the return was 30.85%, and over 5 years 62.18%.
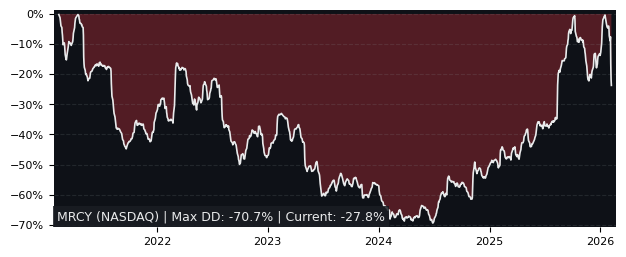
MRCY has relatively low risk with a maximum drawdown of 35.04% over the past 3 years. The average drawdown is 12.02%.
MRCY vs Sectors 12m
| SECTOR | ETF | DIFFERENCE 12M |
|---|---|---|
| Communication Services | XLC | 105% |
| Consumer Discretionary | XLY | 104.3% |
| Consumer Staples | XLP | 103.7% |
| Financials | XLF | 103% |
| Real Estate | XLRE | 100.7% |
| Real Estate | XLRE | 100.7% |
| Materials | XLB | 96.7% |
| Health Care | XLV | 89.4% |
| Industrials | XLI | 88.6% |
| Energy | XLE | 81.8% |
| Technology | XLK | 64.5% |
MRCY vs Asset Classes 12m
| ASSET CLASS | ETF | DIFFERENCE 12M |
|---|---|---|
| S&P 500 | SPY | 88.4% |
| Emerging Market | EEM | 69.5% |
| Gold | GLD | 88.2% |
| Long-Term Bonds | TLT | 107.4% |
| Risk-Free Cash | SHY | 107.7% |