RGTI Performance: 70.5% Return (12 Months)
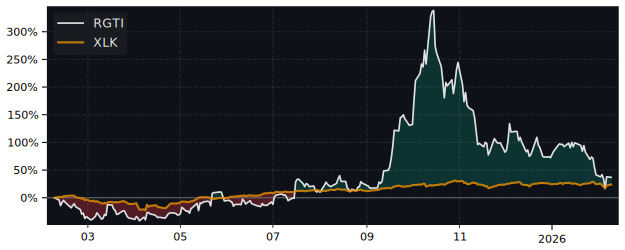
RGTI returned 70.5% over 12 months, outperforming the S&P 500 (32.1%). Volatility: 100.7%.
| P/E Trailing | 0.00 |
| P/E Forward | 0.00 |
| 52 Week High | 56.34 USD |
| 52 Week Low | 7.50 USD |
| VRO Trend Strength ±100 | 19.66 |
| Buy Signal ±3 | -1.16 |
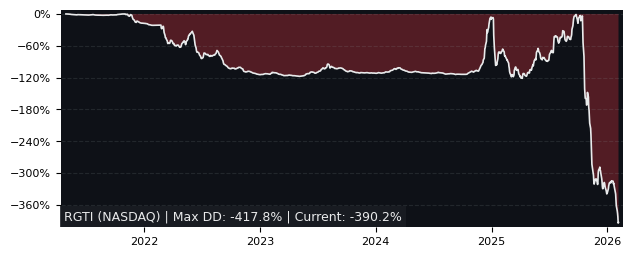
| Max Drawdown | 78.83% |
| Mean Drawdown | 46.87% |
Top Performer in Electronic Equipment & Instruments (5/28)
| SYMBOL | 1W | 1M | 3M |
|---|---|---|---|
| LASR | 7.78% | -0.75% | 54.38% |
| KEYS | 8.73% | 7.52% | 37.11% |
| TSAT | 27.49% | 39.11% | 35.42% |
| COHR | 15.28% | 7.42% | 30.45% |
| CGNX | 7.79% | 0.14% | 28.48% |
| RGTI | 10.08% | -16.52% | -44.05% |
| SYMBOL | 6M | 12M | 5Y |
|---|---|---|---|
| LASR | 89.08% | 743.48% | 79.80% |
| COHR | 120.63% | 379.31% | 232.22% |
| NEWP | 53.33% | 360.00% | 7.11% |
| FEIM | 41.76% | 259.75% | 490.68% |
| KEYS | 68.99% | 125.51% | 102.50% |
| RGTI | -65.96% | 70.47% | 43.43% |
| SYMBOL | MCAP | 1M | 12M | 5Y | P/E | P/E fwd | PEG | EPS stab | EPS cagr |
|---|---|---|---|---|---|---|---|---|---|
| KEYS NYSE Keysight Technologies |
50.0B | 7.52% | 126% | 103% | 51.3 | 32.4 | 1.72 | -42.8% | 4.65% |
| NSSC NASDAQ NAPCO Security Technologies |
1.42B | -1.89% | 102% | 136% | 30.2 | 25.3 | 16.3 | 8.40% | -42.3% |
| CODA NASDAQ Coda Octopus |
131M | -18.1% | 97.2% | 34.9% | 31.4 | 21.9 | 3.81 | -2.30% | 14.3% |
| CGNX NASDAQ Cognex |
8.21B | 0.14% | 104% | -39.2% | 72.3 | 33.9 | 2.71 | -29.6% | -55.6% |
Performance: RGTI vs S&P 500
| PERIOD | RGTI | S&P 500 | DIFFERENCE |
|---|---|---|---|
| 1 Month | -16.52% | -1.73% | -15.05% |
| 3 Months | -44.05% | -4.49% | -41.42% |
| 6 Months | -65.96% | -1.33% | -65.50% |
| 12 Months | 70.47% | 32.14% | 29.00% |
| 5 Years | 43.43% | 72.70% | -16.18% |
RGTI Performance FAQ
Does RGTI outperform the market?
Yes, RGTI significantly outperforms the market. Over the past 12 months, RGTI returned 70.47% compared to 32.14% for the S&P 500.
What is the RGTI return over the last 12 months?
RGTI has returned 70.47% over the past 12 months, including dividends. Over 3 months the return was -44.05%, and over 5 years 43.43%.
How risky is RGTI?
RGTI has relatively low risk with a maximum drawdown of 78.83% over the past 3 years. The average drawdown is 46.87%.
RGTI vs Sectors (12m)
Sorted by outperformance. Positive = RGTI beats sector.
| SECTOR | ETF | DIFFERENCE 12M |
|---|---|---|
| Consumer Staples | XLP | 60.9% |
| Health Care | XLV | 59.8% |
| Real Estate | XLRE | 56.8% |
| Financials | XLF | 55.6% |
| Consumer Discretionary | XLY | 48.8% |
| Consumer Discretionary | XLY | 48.8% |
| Communication Services | XLC | 40.9% |
| Materials | XLB | 36.8% |
| Industrials | XLI | 28.4% |
| Technology | XLK | 20.5% |
| Energy | XLE | 13% |
RGTI vs Asset Classes (12m)
| ASSET CLASS | ETF | DIFFERENCE 12M |
|---|---|---|
| S&P 500 | SPY | 29.00% |
| Gold | GLD | 14.2% |
| Long-Term Bonds | TLT | 69.9% |