SWKS Performance: 9.4% Return (12 Months)
SWKS returned 9.4% over 12 months, underperforming the S&P 500 (32.1%). Volatility: 40.5%.
| P/E Trailing | 21.2 |
| P/E Forward | 11.7 |
| 52 Week High | 81.06 USD |
| 52 Week Low | 47.16 USD |
| VRO Trend Strength ±100 | 54.41 |
| Buy Signal ±3 | -0.36 |
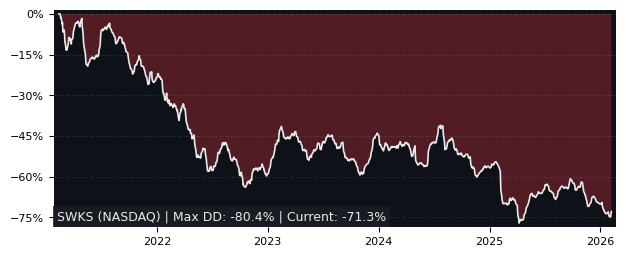
| Max Drawdown | 58.20% |
| Mean Drawdown | 23.97% |
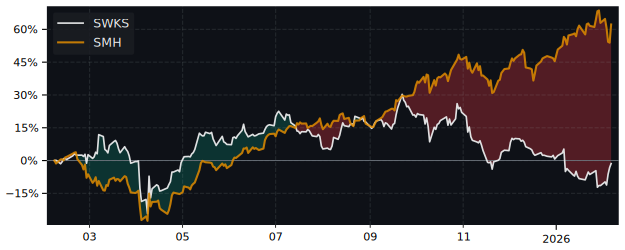
Top Performer in Semiconductors (5/60)
| SYMBOL | 1W | 1M | 3M |
|---|---|---|---|
| TSEM | 19.93% | 71.98% | 55.54% |
| DIOD | 14.44% | 18.95% | 34.25% |
| S92 | 6.03% | 59.23% | 31.83% |
| ARM | 8.62% | 30.07% | 28.77% |
| MRVL | 24.71% | 22.26% | 24.21% |
| SWKS | 6.61% | 2.12% | -14.53% |
| SYMBOL | 6M | 12M | 5Y |
|---|---|---|---|
| WOLF | -31.03% | 596.91% | -84.29% |
| TSEM | 157.74% | 497.14% | 535.24% |
| SKYT | 59.49% | 358.11% | 60.88% |
| S92 | 103.40% | 248.11% | -1.63% |
| ASX | 97.98% | 207.88% | 262.77% |
| SWKS | -25.51% | 9.39% | -66.11% |
| SYMBOL | MCAP | 1M | 12M | 5Y | P/E | P/E fwd | PEG | EPS stab | EPS cagr |
|---|---|---|---|---|---|---|---|---|---|
| MTSI NASDAQ MACOM Technology Solutions |
17.9B | 12.3% | 159% | 290% | 108 | 52.6 | 0.83 | -9.30% | -46.9% |
| TSM NYSE Taiwan Semiconductor |
1,758B | 1.07% | 136% | 199% | 32.7 | 24.9 | 1.21 | 7.30% | -46.3% |
| SMTC NASDAQ Semtech |
7.68B | 0.76% | 192% | 16.5% | - | 36.8 | 3.39 | -36.7% | -14.7% |
| MPWR NASDAQ Monolithic Power Systems |
54.9B | 15.6% | 143% | 223% | 87.0 | 51.0 | 1.84 | -16.7% | -47.4% |
| AIP NASDAQ Arteris |
828M | 25.6% | 209% | 0.22% | - | - | - | 57.7% | 12.9% |
| CRUS NASDAQ Cirrus Logic |
7.51B | 14.1% | 79.4% | 72.8% | 19.4 | 15.7 | 9.35 | 1.10% | -41.5% |
| ADI NASDAQ Analog Devices |
157B | 3.66% | 94.0% | 120% | 58.5 | 27.6 | 0.80 | -57.8% | -8.93% |
| MRVL NASDAQ Marvell Technology |
93.7B | 22.3% | 115% | 122% | 34.9 | 27.8 | 1.25 | 33.6% | 12.2% |
| AMD NASDAQ Advanced Micro Devices |
355B | 14.4% | 163% | 164% | 83.3 | 32.5 | 0.65 | 25.9% | 8.42% |
| RMBS NASDAQ Rambus |
10.1B | 4.65% | 106% | 351% | 44.1 | 24.2 | 3.80 | 53.6% | 134% |
Performance: SWKS vs S&P 500
| PERIOD | SWKS | S&P 500 | DIFFERENCE |
|---|---|---|---|
| 1 Month | 2.12% | -1.73% | 3.92% |
| 3 Months | -14.53% | -4.49% | -10.51% |
| 6 Months | -25.51% | -1.33% | -24.51% |
| 12 Months | 9.39% | 32.14% | -17.21% |
| 5 Years | -66.11% | 72.70% | -80.38% |
SWKS Performance FAQ
Does SWKS outperform the market?
No, SWKS underperforms the market. Over the past 12 months, SWKS returned 9.39% compared to 32.14% for the S&P 500.
What is the SWKS return over the last 12 months?
SWKS has returned 9.39% over the past 12 months, including dividends. Over 3 months the return was -14.53%, and over 5 years -66.11%.
How risky is SWKS?
SWKS has relatively low risk with a maximum drawdown of 58.20% over the past 3 years. The average drawdown is 23.97%.
SWKS vs Sectors (12m)
Sorted by outperformance. Positive = SWKS beats sector.
| SECTOR | ETF | DIFFERENCE 12M |
|---|---|---|
| Consumer Staples | XLP | -0.1% |
| Health Care | XLV | -1.3% |
| Real Estate | XLRE | -4.3% |
| Financials | XLF | -5.5% |
| Consumer Discretionary | XLY | -12.3% |
| Consumer Discretionary | XLY | -12.3% |
| Communication Services | XLC | -20.1% |
| Materials | XLB | -24.3% |
| Industrials | XLI | -32.7% |
| Technology | XLK | -40.6% |
| Energy | XLE | -48% |
SWKS vs Asset Classes (12m)
| ASSET CLASS | ETF | DIFFERENCE 12M |
|---|---|---|
| S&P 500 | SPY | -17.21% |
| Gold | GLD | -46.9% |
| Long-Term Bonds | TLT | 8.8% |