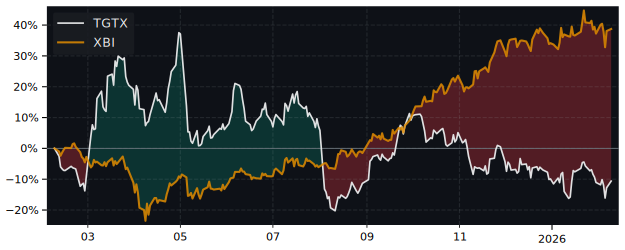
TGTX Performance: -10% Return (12 Months)
TGTX returned -10.0% over 12 months, underperforming the S&P 500 (31.5%). Volatility: 61.1%.
| P/E Trailing | 12.1 |
| P/E Forward | 27.8 |
| 52 Week High | 45.51 USD |
| 52 Week Low | 26.39 USD |
| VRO Trend Strength ±100 | 93.74 |
| Buy Signal ±3 | 0.00 |
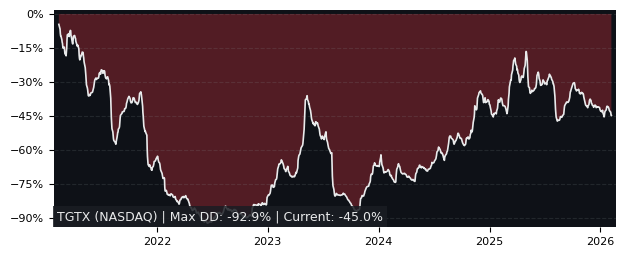
| Max Drawdown | 80.91% |
| Mean Drawdown | 35.30% |
Top Performer in Biotechnology (5/200)
| SYMBOL | 1W | 1M | 3M |
|---|---|---|---|
| ERAS | 19.21% | 14.61% | 410.32% |
| DAWN | 0.14% | 67.84% | 150.88% |
| TNGX | 12.60% | 28.52% | 142.76% |
| DNTH | 8.24% | 40.00% | 133.13% |
| ORKA | 17.11% | 60.72% | 98.33% |
| TGTX | 6.41% | 15.50% | 12.14% |
| SYMBOL | 6M | 12M | 5Y |
|---|---|---|---|
| ABVX | 36.58% | 2163.29% | 920.43% |
| ABVX | 33.07% | 1990.72% | 412.12% |
| KOD | 177.34% | 1763.76% | -64.84% |
| TNGX | 185.36% | 1603.15% | 96.82% |
| ERAS | 664.38% | 1353.88% | 2.18% |
| TGTX | -8.79% | -9.99% | -29.96% |
| SYMBOL | MCAP | 1M | 12M | 5Y | P/E | P/E fwd | PEG | EPS stab | EPS cagr |
|---|---|---|---|---|---|---|---|---|---|
| ROIV NASDAQ Roivant Sciences |
20.3B | -4.68% | 206% | 189% | - | - | - | 37.2% | -14.4% |
| UTHR NASDAQ United Therapeutics |
24.8B | 16.4% | 93.6% | 193% | 20.3 | 20.0 | 2.25 | -2.20% | -35.9% |
| DAWN NASDAQ Day One Biopharmaceuticals |
2.22B | 67.8% | 206% | -17.2% | - | - | - | 57.3% | 49.0% |
| FOLD NASDAQ Amicus Therapeutics |
4.53B | 0.77% | 102% | 45.3% | - | 30.5 | -0.18 | 83.6% | 131% |
| GLUE NASDAQ Monte Rosa Therapeutics |
1.37B | -4.79% | 321% | -19.3% | - | 10.9 | - | 59.8% | 43.8% |
| MIRM NASDAQ Mirum Pharmaceuticals |
5.57B | 7.21% | 130% | 363% | - | - | - | 84.0% | 24.5% |
| KRYS NASDAQ Krystal Biotech |
7.57B | 0.24% | 57.2% | 231% | 37.9 | 44.8 | - | 84.4% | 26.5% |
| AUPH NASDAQ Aurinia Pharmaceuticals |
2.08B | 5.90% | 106% | 20.1% | 7.54 | 22.7 | - | 63.8% | 123% |
| STRO NASDAQ Sutro Biopharma |
394M | 5.69% | 231% | -90.0% | - | 8.96 | - | -29.4% | -68.0% |
| PHARM AS Pharming |
1.17B | 6.07% | 102% | 30.2% | - | 100 | - | -4.20% | - |
Performance: TGTX vs S&P 500
| PERIOD | TGTX | S&P 500 | DIFFERENCE |
|---|---|---|---|
| 1 Month | 15.50% | -3.48% | 19.66% |
| 3 Months | 12.14% | -4.38% | 17.27% |
| 6 Months | -8.79% | -1.79% | -7.12% |
| 12 Months | -9.99% | 31.52% | -31.56% |
| 5 Years | -29.96% | 72.80% | -59.47% |
TGTX Performance FAQ
Does TGTX outperform the market?
No, TGTX underperforms the market. Over the past 12 months, TGTX returned -9.99% compared to 31.52% for the S&P 500.
What is the TGTX return over the last 12 months?
TGTX has returned -9.99% over the past 12 months, including dividends. Over 3 months the return was 12.14%, and over 5 years -29.96%.
How risky is TGTX?
TGTX has relatively low risk with a maximum drawdown of 80.91% over the past 3 years. The average drawdown is 35.30%.
TGTX vs Sectors (12m)
Sorted by outperformance. Positive = TGTX beats sector.
| SECTOR | ETF | DIFFERENCE 12M |
|---|---|---|
| Consumer Staples | XLP | -18.5% |
| Health Care | XLV | -21.1% |
| Real Estate | XLRE | -23.2% |
| Financials | XLF | -24.1% |
| Consumer Discretionary | XLY | -30.7% |
| Communication Services | XLC | -39.5% |
| Communication Services | XLC | -39.5% |
| Materials | XLB | -44.1% |
| Industrials | XLI | -51.4% |
| Technology | XLK | -59.1% |
| Energy | XLE | -66.3% |
TGTX vs Asset Classes (12m)
| ASSET CLASS | ETF | DIFFERENCE 12M |
|---|---|---|
| S&P 500 | SPY | -31.56% |
| Gold | GLD | -66.9% |
| Long-Term Bonds | TLT | -10.8% |