TIGO Performance: 216.3% Return (12 Months)
TIGO returned 216.3% over 12 months, outperforming the S&P 500 (31.5%). Volatility: 40.7%.
| P/E Trailing | 10.2 |
| P/E Forward | 21.0 |
| 52 Week High | 79.64 USD |
| 52 Week Low | 24.96 USD |
| VRO Trend Strength ±100 | 81.39 |
| Buy Signal ±3 | 1.36 |
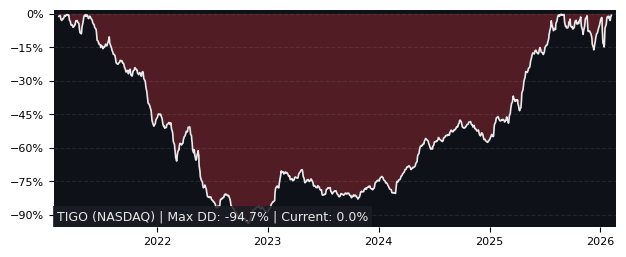
| Max Drawdown | 26.69% |
| Mean Drawdown | 7.35% |
Top Performer in Wireless Telecommunication Services (5/17)
| SYMBOL | 1W | 1M | 3M |
|---|---|---|---|
| ATEX | 10.69% | 3.56% | 78.48% |
| SKM | 3.39% | 0.44% | 43.31% |
| TIGO | 8.90% | 12.09% | 41.25% |
| SHEN | 0.40% | -1.88% | 33.39% |
| TIMB | 3.57% | 3.84% | 32.91% |
| AMX | 3.86% | 4.84% | 22.69% |
| SYMBOL | 6M | 12M | 5Y |
|---|---|---|---|
| TIGO | 73.91% | 216.32% | 135.20% |
| TIMB | 23.94% | 98.28% | 233.18% |
| VOD | 37.64% | 90.83% | 15.85% |
| AMX | 23.99% | 89.86% | 111.70% |
| SKM | 37.97% | 44.34% | 41.13% |
| ATEX | 81.20% | 23.29% | -15.89% |
Performance: TIGO vs S&P 500
| PERIOD | TIGO | S&P 500 | DIFFERENCE |
|---|---|---|---|
| 1 Month | 12.09% | -3.48% | 16.13% |
| 3 Months | 41.25% | -4.38% | 47.72% |
| 6 Months | 73.91% | -1.79% | 77.09% |
| 12 Months | 216.32% | 31.52% | 140.51% |
| 5 Years | 135.20% | 72.80% | 36.11% |
TIGO Performance FAQ
Does TIGO outperform the market?
Yes, TIGO significantly outperforms the market. Over the past 12 months, TIGO returned 216.32% compared to 31.52% for the S&P 500.
What is the TIGO return over the last 12 months?
TIGO has returned 216.32% over the past 12 months, including dividends. Over 3 months the return was 41.25%, and over 5 years 135.20%.
How risky is TIGO?
TIGO has relatively low risk with a maximum drawdown of 26.69% over the past 3 years. The average drawdown is 7.35%.
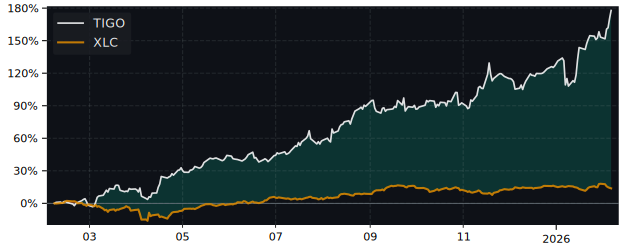
TIGO vs Sectors (12m)
Sorted by outperformance. Positive = TIGO beats sector.
| SECTOR | ETF | DIFFERENCE 12M |
|---|---|---|
| Consumer Staples | XLP | 207.8% |
| Health Care | XLV | 205.2% |
| Real Estate | XLRE | 203.1% |
| Financials | XLF | 202.3% |
| Consumer Discretionary | XLY | 195.6% |
| Communication Services | XLC | 186.9% |
| Communication Services | XLC | 186.9% |
| Materials | XLB | 182.2% |
| Industrials | XLI | 174.9% |
| Technology | XLK | 167.2% |
| Energy | XLE | 160% |
TIGO vs Asset Classes (12m)
| ASSET CLASS | ETF | DIFFERENCE 12M |
|---|---|---|
| S&P 500 | SPY | 140.51% |
| Gold | GLD | 159.4% |
| Long-Term Bonds | TLT | 215.6% |