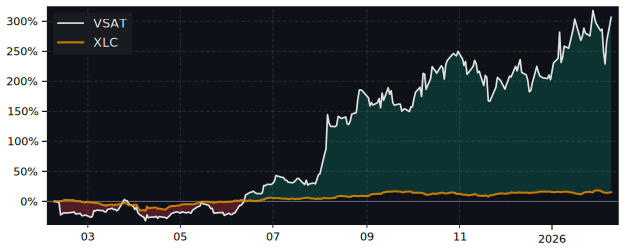
VSAT Performance: 544.5% Return (12 Months)
VSAT returned 544.5% over 12 months, outperforming the S&P 500 (31.5%). Volatility: 114.6%.
| P/E Trailing | 0.00 |
| P/E Forward | 145 |
| 52 Week High | 53.69 USD |
| 52 Week Low | 7.70 USD |
| VRO Trend Strength ±100 | 70.05 |
| Buy Signal ±3 | 0.57 |
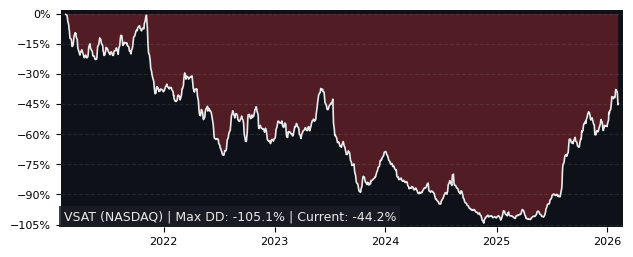
| Max Drawdown | 85.53% |
| Mean Drawdown | 50.72% |
Top Performer in Communications Equipment (5/31)
| SYMBOL | 1W | 1M | 3M |
|---|---|---|---|
| LITE | 26.28% | 27.05% | 131.59% |
| VIAV | 15.97% | 19.00% | 103.70% |
| CIEN | 22.67% | 49.60% | 93.92% |
| UI | 14.11% | 8.61% | 49.18% |
| ADTN | 5.66% | 28.03% | 47.03% |
| VSAT | 22.80% | 17.92% | 39.45% |
| SYMBOL | 6M | 12M | 5Y |
|---|---|---|---|
| LITE | 414.87% | 1482.24% | 783.42% |
| CIEN | 192.18% | 710.87% | 688.45% |
| VSAT | 62.65% | 544.54% | 4.52% |
| SATS | 67.60% | 506.69% | 421.18% |
| VISN | 22.74% | 414.56% | 19.76% |
| VIAV | 188.65% | 273.00% | 127.86% |
| SYMBOL | MCAP | 1M | 12M | 5Y | P/E | P/E fwd | PEG | EPS stab | EPS cagr |
|---|---|---|---|---|---|---|---|---|---|
| ERIC NASDAQ Telefonaktiebolaget LM |
38.5B | 4.71% | 74.0% | 4.37% | 12.7 | 16.8 | 3.53 | 35.4% | -10.1% |
| DGII NASDAQ Digi International |
1.88B | -0.28% | 107% | 156% | 44.6 | 20.5 | 0.83 | 86.8% | 8.67% |
| ADCT NYSE ADC Therapeutics |
480M | -9.79% | 223% | -86.0% | - | - | - | 54.8% | 5.26% |
Performance: VSAT vs S&P 500
| PERIOD | VSAT | S&P 500 | DIFFERENCE |
|---|---|---|---|
| 1 Month | 17.92% | -3.48% | 22.17% |
| 3 Months | 39.45% | -4.38% | 45.84% |
| 6 Months | 62.65% | -1.79% | 65.62% |
| 12 Months | 544.54% | 31.52% | 390.07% |
| 5 Years | 4.52% | 72.80% | -39.52% |
VSAT Performance FAQ
Does VSAT outperform the market?
Yes, VSAT significantly outperforms the market. Over the past 12 months, VSAT returned 544.54% compared to 31.52% for the S&P 500.
What is the VSAT return over the last 12 months?
VSAT has returned 544.54% over the past 12 months, including dividends. Over 3 months the return was 39.45%, and over 5 years 4.52%.
How risky is VSAT?
VSAT has relatively low risk with a maximum drawdown of 85.53% over the past 3 years. The average drawdown is 50.72%.
VSAT vs Sectors (12m)
Sorted by outperformance. Positive = VSAT beats sector.
| SECTOR | ETF | DIFFERENCE 12M |
|---|---|---|
| Consumer Staples | XLP | 536% |
| Health Care | XLV | 533.4% |
| Real Estate | XLRE | 531.3% |
| Financials | XLF | 530.5% |
| Consumer Discretionary | XLY | 523.9% |
| Communication Services | XLC | 515.1% |
| Communication Services | XLC | 515.1% |
| Materials | XLB | 510.4% |
| Industrials | XLI | 503.2% |
| Technology | XLK | 495.4% |
| Energy | XLE | 488.2% |
VSAT vs Asset Classes (12m)
| ASSET CLASS | ETF | DIFFERENCE 12M |
|---|---|---|
| S&P 500 | SPY | 390.07% |
| Gold | GLD | 487.7% |
| Long-Term Bonds | TLT | 543.8% |