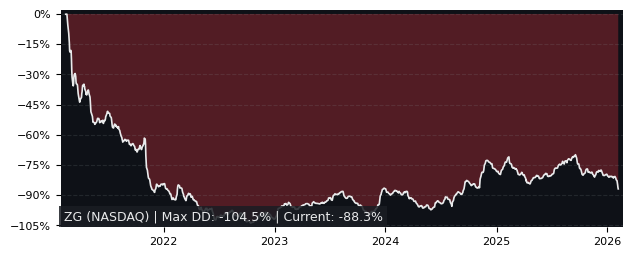
ZG Performance: -37.4% Return (12 Months)
ZG returned -37.4% over 12 months, underperforming the S&P 500 (25.4%). Volatility: 50.1%.
| P/E Trailing | 452 |
| P/E Forward | 20.0 |
| 52 Week High | 86.76 USD |
| 52 Week Low | 40.41 USD |
| VRO Trend Strength ±100 | 21.85 |
| Buy Signal ±3 | -1.39 |
| Max Drawdown | 53.42% |
| Mean Drawdown | 16.29% |
Top Performer in Real Estate Development (5/20)
| SYMBOL | 1W | 1M | 3M |
|---|---|---|---|
| MVC | 3.42% | 7.56% | 23.72% |
| CBL | 5.64% | 13.04% | 14.18% |
| KW | -0.09% | 1.20% | 12.39% |
| IRS | 0.00% | 11.82% | 1.83% |
| BRSP | 3.57% | 4.56% | 1.71% |
| ZG | 0.02% | -9.95% | -39.47% |
| SYMBOL | 6M | 12M | 5Y |
|---|---|---|---|
| OPEN | -47.05% | 295.41% | -77.79% |
| CBL | 50.76% | 88.47% | 101.01% |
| KW | 46.46% | 58.73% | -30.28% |
| MVC | 31.43% | 48.86% | 197.22% |
| IRS | 50.29% | 48.82% | 562.61% |
| ZG | -40.39% | -37.42% | -71.90% |
| SYMBOL | MCAP | 1M | 12M | 5Y | P/E | P/E fwd | PEG | EPS stab | EPS cagr |
|---|---|---|---|---|---|---|---|---|---|
| IRS NYSE IRSA Inversiones Y |
1.34B | 11.8% | 48.8% | 563% | 3.83 | 38.2 | 2.73 | 10.4% | -8.83% |
| JLL NYSE Jones Lang LaSalle |
15.0B | 6.09% | 43.2% | 75.8% | 18.8 | 14.4 | 1.02 | 3.40% | -50.9% |
Performance: ZG vs S&P 500
| PERIOD | ZG | S&P 500 |
|---|---|---|
| 1 Week | 0.02% | 3.67% |
| 1 Month | -9.95% | 0.52% |
| 3 Months | -39.47% | -1.77% |
| 6 Months | -40.39% | 1.88% |
| 12 Months | -37.42% | 25.35% |
| 5 Years | -71.90% | 76.85% |
ZG Performance FAQ
Does ZG outperform the market?
No, ZG underperforms the market. Over the past 12 months, ZG returned -37.42% compared to 25.35% for the S&P 500.
What is the ZG return over the last 12 months?
ZG has returned -37.42% over the past 12 months, including dividends. Over 3 months the return was -39.47%, and over 5 years -71.90%.
How risky is ZG?
ZG has relatively low risk with a maximum drawdown of 53.42% over the past 3 years. The average drawdown is 16.29%.
ZG vs Sectors (12m)
Sorted by outperformance. Positive = ZG beats sector.
| SECTOR | ETF | DIFFERENCE 12M |
|---|---|---|
| Consumer Staples | XLP | -45.6% |
| Health Care | XLV | -47% |
| Financials | XLF | -47.8% |
| Real Estate | XLRE | -50.2% |
| Consumer Discretionary | XLY | -53.6% |
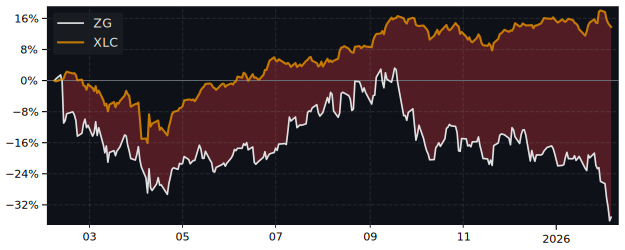
| Communication Services | XLC | -60.8% |
| Communication Services | XLC | -60.8% |
| Materials | XLB | -67.9% |
| Industrials | XLI | -75.1% |
| Technology | XLK | -77.6% |
| Energy | XLE | -81.1% |
ZG vs Asset Classes (12m)
| ASSET CLASS | ETF | DIFFERENCE 12M |
|---|---|---|
| S&P 500 | SPY | -62.8% |
| Emerging Market | EEM | -87.3% |
| Gold | GLD | -90.9% |
| Long-Term Bonds | TLT | -39.4% |
| Risk-Free Cash | SHY | -41% |