ET Performance: 15.3% Return (12 Months)
ET returned 15.3% over 12 months, underperforming the S&P 500 (23.6%). Volatility: 18.6%.
RS IBD
40.33
Top 89% in Peers
Volatility
18.6%
Top 15% in Peers
Total Return 12m
15.26%
Top 85% in Peers
RS Rating
69.85
Top 89% in Peers
P/E
| P/E Trailing | 16.0 |
| P/E Forward | 11.8 |
High / Low 52w
| 52 Week High | 19.67 USD |
| 52 Week Low | 14.50 USD |
Sentiment
| VRO Trend Strength ±100 | 81.78 |
| Buy Signal ±3 | -0.33 |
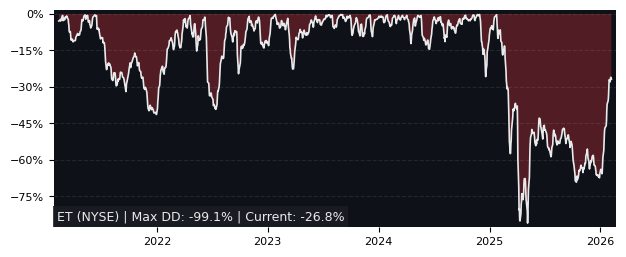
Drawdowns 3y
| Max Drawdown | 24.56% |
| Mean Drawdown | 5.43% |
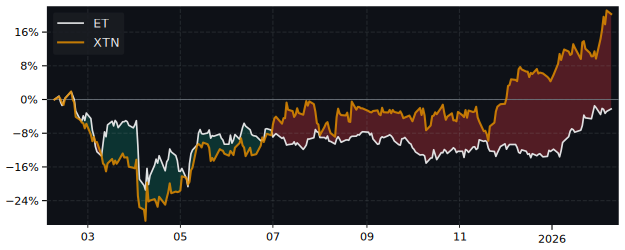
Compare performance with 50 peers in Oil & Gas Storage & Transportation
12m Total Return: ET (15.3%) vs SPY (23.6%)
5y Drawdown (Underwater) Chart
Top Performer in Oil & Gas Storage & Transportation (5/50)
Short Term Performance
| SYMBOL | 1W | 1M | 3M |
|---|---|---|---|
| TEN | 5.37% | 10.66% | 88.55% |
| NAT | 8.66% | 9.71% | 85.97% |
| FRO | 8.77% | 1.67% | 81.63% |
| NEXT | -3.44% | 39.93% | 45.91% |
| GLNG | 0.47% | 21.50% | 45.78% |
| ET | -3.76% | 0.37% | 17.45% |
Long Term Performance
| SYMBOL | 6M | 12M | 5Y |
|---|---|---|---|
| NAT | 97.29% | 195.91% | 192.47% |
| NGL | 106.23% | 175.27% | 504.81% |
| FRO | 64.40% | 172.47% | 605.00% |
| TEN | 88.31% | 166.19% | 418.16% |
| INSW | 67.83% | 162.99% | 528.67% |
| ET | 17.10% | 15.26% | 258.82% |
Overall Best Picks of Peer Group (GARP Metrics)
| SYMBOL | MCAP | 1M | 12M | 5Y | P/E | P/E fwd | PEG | EPS stab | EPS cagr |
|---|---|---|---|---|---|---|---|---|---|
| TGS NYSE Transportadora de Gas del |
5.33B | 22.6% | 43.5% | 654% | 16.9 | 8.56 | - | 36.5% | -11.1% |
| TK NYSE Teekay |
855M | 1.03% | 132% | 643% | 11.3 | 9.61 | 1.49 | 4.70% | 44.1% |
| DHT NYSE DHT Holdings |
2.92B | -3.12% | 101% | 324% | 13.8 | 8.80 | 1.19 | 59.0% | 130% |
| INSW NYSE International Seaways |
3.51B | 2.78% | 163% | 529% | 11.4 | 9.54 | - | -64.6% | -42.1% |
| GTT PA Gaztransport & Technigaz SAS |
8.56B | 4.73% | 54.8% | 259% | 17.9 | 21.1 | - | -4.60% | -74.3% |
| TRMD NASDAQ Torm |
2.86B | -3.34% | 114% | 489% | 9.83 | 7.30 | - | -85.1% | -66.2% |
Performance: ET vs S&P 500
| Total Return | ET | S&P 500 | Difference |
|---|---|---|---|
| 1 Month | 0.37% | -3.34% | 3.84% |
| 3 Months | 17.45% | -4.38% | 22.8% |
| 6 Months | 17.10% | -1.44% | 18.8% |
| 12 Months | 15.26% | 23.60% | -6.75% |
| 5 Years | 258.82% | 72.80% | 108% |
FAQs
Does ET outperform the market?
No, ET underperforms the market.
Over the past 12 months, ET returned 15.26% compared to 23.60% for the S&P 500.
What is the ET return over the last 12 months?
ET has returned 15.26% over the past 12 months, including dividends.
Over 3 months the return was 17.45%, and over 5 years 258.82%.
How risky is ET?
ET has relatively low risk with a maximum drawdown of 24.56% over the past 3 years.
The average drawdown is 5.43%.
ET vs Sectors (12m)
Sorted by outperformance. Positive = ET beats sector.
| Sector | ETF | Difference |
|---|---|---|
| Consumer Staples | XLP | 12.7% |
| Health Care | XLV | 10.9% |
| Financials | XLF | 9.80% |
| Real Estate | XLRE | 9.78% |
| Consumer Discretionary | XLY | 1.14% |
| Consumer Discretionary | XLY | 1.14% |
| Communication Services | XLC | -6.95% |
| Materials | XLB | -8.47% |
| Industrials | XLI | -16.6% |
| Technology | XLK | -24.9% |
| Energy | XLE | -25.7% |
ET vs Asset Classes (12m)
| Asset Class | ETF | Difference |
|---|---|---|
| S&P 500 | SPY | -6.75% |
| Gold | GLD | -34.7% |
| Long-Term Bonds | TLT | 16.5% |