FIS Performance: -30.9% Return (12 Months)
FIS returned -30.9% over 12 months, underperforming the S&P 500 (31.5%). Volatility: 29.0%.
| P/E Trailing | 63.4 |
| P/E Forward | 7.40 |
| 52 Week High | 80.68 USD |
| 52 Week Low | 45.17 USD |
| VRO Trend Strength ±100 | 22.60 |
| Buy Signal ±3 | -0.46 |
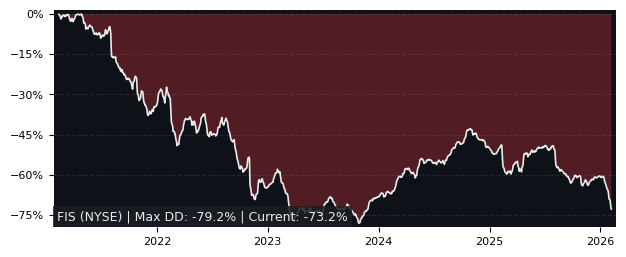
| Max Drawdown | 48.55% |
| Mean Drawdown | 12.28% |
Top Performer in Transaction & Payment Processing Services (5/17)
| SYMBOL | 1W | 1M | 3M |
|---|---|---|---|
| RELY | 4.57% | -7.51% | 22.20% |
| EVTC | 0.54% | -2.20% | -5.35% |
| STNE | 2.65% | 1.16% | -8.04% |
| PAYO | 3.14% | 1.44% | -9.72% |
| DLO | 3.71% | 8.80% | -12.93% |
| FIS | -2.44% | -7.69% | -29.66% |
| SYMBOL | 6M | 12M | 5Y |
|---|---|---|---|
| DLO | -9.24% | 67.48% | -58.32% |
| STNE | -21.98% | 31.36% | -77.95% |
| FLYW | -12.55% | 30.60% | -66.44% |
| WU | 13.46% | -0.06% | -49.05% |
| JKHY | 7.37% | -5.73% | 6.60% |
| FIS | -30.05% | -30.89% | -64.13% |
Performance: FIS vs S&P 500
| PERIOD | FIS | S&P 500 | DIFFERENCE |
|---|---|---|---|
| 1 Month | -7.69% | -3.48% | -4.37% |
| 3 Months | -29.66% | -4.38% | -26.44% |
| 6 Months | -30.05% | -1.79% | -28.77% |
| 12 Months | -30.89% | 31.52% | -47.45% |
| 5 Years | -64.13% | 72.80% | -79.24% |
FIS Performance FAQ
Does FIS outperform the market?
No, FIS underperforms the market. Over the past 12 months, FIS returned -30.89% compared to 31.52% for the S&P 500.
What is the FIS return over the last 12 months?
FIS has returned -30.89% over the past 12 months, including dividends. Over 3 months the return was -29.66%, and over 5 years -64.13%.
How risky is FIS?
FIS has relatively low risk with a maximum drawdown of 48.55% over the past 3 years. The average drawdown is 12.28%.
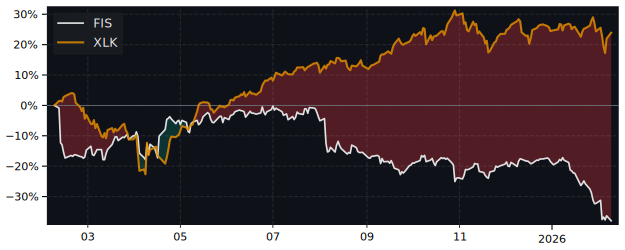
FIS vs Sectors (12m)
Sorted by outperformance. Positive = FIS beats sector.
| SECTOR | ETF | DIFFERENCE 12M |
|---|---|---|
| Consumer Staples | XLP | -39.4% |
| Health Care | XLV | -42% |
| Real Estate | XLRE | -44.1% |
| Financials | XLF | -45% |
| Consumer Discretionary | XLY | -51.6% |
| Communication Services | XLC | -60.4% |
| Communication Services | XLC | -60.4% |
| Materials | XLB | -65% |
| Industrials | XLI | -72.3% |
| Technology | XLK | -80% |
| Energy | XLE | -87.2% |
FIS vs Asset Classes (12m)
| ASSET CLASS | ETF | DIFFERENCE 12M |
|---|---|---|
| S&P 500 | SPY | -47.45% |
| Gold | GLD | -87.8% |
| Long-Term Bonds | TLT | -31.7% |