NEXA Performance: 82.6% Return (12 Months)
NEXA returned 82.6% over 12 months, outperforming the S&P 500 (32.1%). Volatility: 71.4%.
| P/E Trailing | 11.1 |
| P/E Forward | 3.45 |
| 52 Week High | 14.66 USD |
| 52 Week Low | 4.66 USD |
| VRO Trend Strength ±100 | 42.34 |
| Buy Signal ±3 | -0.13 |
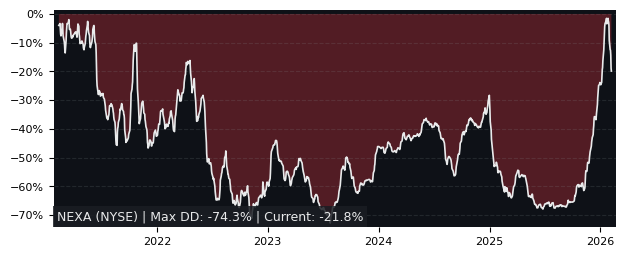
| Max Drawdown | 47.02% |
| Mean Drawdown | 19.68% |
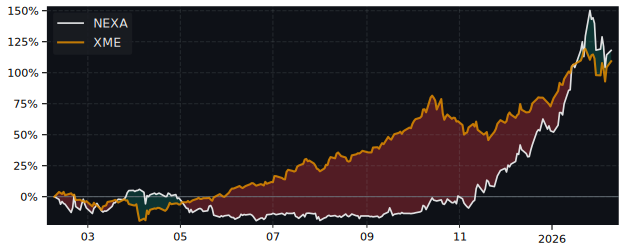
Top Performer in Diversified Metals & Mining (5/47)
| SYMBOL | 1W | 1M | 3M |
|---|---|---|---|
| ECVT | 2.80% | 19.85% | 29.61% |
| RIO | 5.84% | 4.21% | 13.39% |
| AMG | 7.19% | 3.83% | 12.74% |
| NEXA | 10.63% | 0.55% | 12.68% |
| LAR | 11.92% | 11.58% | 6.30% |
| AMR | -2.85% | 23.45% | -1.61% |
| SYMBOL | 6M | 12M | 5Y |
|---|---|---|---|
| LAR | 67.87% | 296.79% | 22.31% |
| SKE | 70.78% | 244.22% | 172.71% |
| CGAU | 58.61% | 233.01% | 128.70% |
| IAUX | 65.92% | 213.94% | -21.15% |
| TMQ | 83.25% | 183.70% | 68.72% |
| NEXA | 115.58% | 82.63% | 14.58% |
| SYMBOL | MCAP | 1M | 12M | 5Y | P/E | P/E fwd | PEG | EPS stab | EPS cagr |
|---|---|---|---|---|---|---|---|---|---|
| VOXR NASDAQ Vox Royalty Common Stock |
363M | -14.4% | 93.4% | 218% | 52.6 | 47.9 | - | -0.20% | -9.86% |
| RIO NYSE Rio Tinto |
154B | 4.21% | 81.4% | 73.5% | 15.5 | 11.7 | 5.69 | -4.50% | - |
| BHP NYSE BHP |
187B | 1.31% | 79.2% | 61.6% | 18.2 | 14.6 | 5.95 | -18.2% | -41.4% |
| CGAU NYSE Centerra Gold |
3.55B | -2.03% | 233% | 129% | 6.26 | 10.8 | - | 67.3% | 18.1% |
| ORLA NYSE MKT Orla Mining |
4.11B | -3.53% | 113% | 342% | 75.6 | 10.9 | - | 17.1% | -4.30% |
| HBM NYSE Hudbay Minerals |
8.63B | -2.44% | 244% | 173% | 15.1 | 12.4 | 2.09 | 38.5% | -21.8% |
| IDR NYSE MKT Idaho Strategic Resources |
557M | -7.35% | 133% | 740% | 30.9 | 26.5 | - | 74.5% | 10.9% |
| ITRG NYSE MKT Integra Resources |
586M | -21.2% | 159% | -3.65% | - | 5.01 | - | 71.8% | 50.3% |
Performance: NEXA vs S&P 500
| PERIOD | NEXA | S&P 500 | DIFFERENCE |
|---|---|---|---|
| 1 Month | 0.55% | -1.73% | 2.32% |
| 3 Months | 12.68% | -4.49% | 17.98% |
| 6 Months | 115.58% | -1.33% | 118.49% |
| 12 Months | 82.63% | 32.14% | 38.21% |
| 5 Years | 14.58% | 72.70% | -33.66% |
NEXA Performance FAQ
Does NEXA outperform the market?
Yes, NEXA significantly outperforms the market. Over the past 12 months, NEXA returned 82.63% compared to 32.14% for the S&P 500.
What is the NEXA return over the last 12 months?
NEXA has returned 82.63% over the past 12 months, including dividends. Over 3 months the return was 12.68%, and over 5 years 14.58%.
How risky is NEXA?
NEXA has relatively low risk with a maximum drawdown of 47.02% over the past 3 years. The average drawdown is 19.68%.
NEXA vs Sectors (12m)
Sorted by outperformance. Positive = NEXA beats sector.
| SECTOR | ETF | DIFFERENCE 12M |
|---|---|---|
| Consumer Staples | XLP | 73.1% |
| Health Care | XLV | 71.9% |
| Real Estate | XLRE | 69% |
| Financials | XLF | 67.8% |
| Consumer Discretionary | XLY | 60.9% |
| Consumer Discretionary | XLY | 60.9% |
| Communication Services | XLC | 53.1% |
| Materials | XLB | 49% |
| Industrials | XLI | 40.5% |
| Technology | XLK | 32.7% |
| Energy | XLE | 25.2% |
NEXA vs Asset Classes (12m)
| ASSET CLASS | ETF | DIFFERENCE 12M |
|---|---|---|
| S&P 500 | SPY | 38.21% |
| Gold | GLD | 26.4% |
| Long-Term Bonds | TLT | 82% |