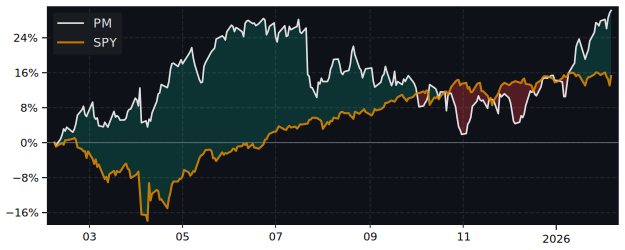
PM Performance: 7.8% Return (12 Months)
PM returned 7.8% over 12 months, underperforming the S&P 500 (32.2%). Volatility: 28.7%.
RS IBD
1.62
Top 49% in Peers
Volatility
28.7%
Top 45% in Peers
Total Return 12m
7.83%
Top 45% in Peers
RS Rating
33.55
Top 49% in Peers
P/E
| P/E Trailing | 22.1 |
| P/E Forward | 18.7 |
High / Low 52w
| 52 Week High | 188.12 USD |
| 52 Week Low | 141.76 USD |
Sentiment
| VRO Trend Strength ±100 | 8.46 |
| Buy Signal ±3 | -0.54 |
Drawdowns 3y
| Max Drawdown | 20.64% |
| Mean Drawdown | 5.41% |
Compare performance with 141 peers in Consumer Staples
12m Total Return: PM (7.8%) vs PEER ETF
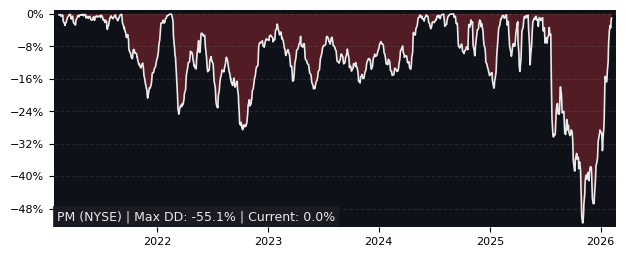
5y Drawdown (Underwater) Chart
Top Performer in Consumer Staples (5/141)
Short Term Performance
| SYMBOL | 1W | 1M | 3M |
|---|---|---|---|
| AGRO | 0.07% | 50.45% | 95.19% |
| DAR | 2.68% | 22.32% | 72.58% |
| SZU | -4.92% | 21.77% | 35.38% |
| WEST | 12.71% | 23.45% | 29.11% |
| OLPX | -0.49% | 57.81% | 22.42% |
| PM | -4.75% | -8.29% | 2.41% |
Long Term Performance
| SYMBOL | 6M | 12M | 5Y |
|---|---|---|---|
| VFF | -19.34% | 427.15% | -79.16% |
| DAR | 105.33% | 120.06% | -14.26% |
| NATR | 64.18% | 116.56% | 27.06% |
| ANDE | 75.28% | 100.29% | 187.54% |
| AGRO | 96.34% | 50.69% | 110.44% |
| PM | 3.75% | 7.83% | 119.29% |
Overall Best Picks of Peer Group (GARP Metrics)
| SYMBOL | MCAP | 1M | 12M | 5Y | P/E | P/E fwd | PEG | EPS stab | EPS cagr |
|---|---|---|---|---|---|---|---|---|---|
| JDEP AS Jde Peets |
17.8B | 0.32% | 67.7% | 15.7% | 19.8 | 15.6 | 1.21 | 2.70% | - |
| AD AS Koninklijke Ahold Delhaize |
42.5B | 1.51% | 31.6% | 109% | 16.7 | 15.3 | 3.55 | 37.7% | 7.84% |
| WMT NASDAQ Walmart Common Stock |
1,003B | -1.29% | 47.4% | 181% | 46.1 | 42.4 | 4.67 | -33.6% | 15.3% |
| BTI NYSE British American Tobacco |
126B | 2.27% | 58.0% | 122% | 12.6 | 11.9 | 1.50 | -0.60% | - |
| TR NYSE Tootsie Roll Industries |
3.19B | 2.46% | 49.2% | 63.8% | 32.9 | 26.7 | 3.43 | -6.80% | -40.6% |
| MO NYSE Altria |
112B | 0.48% | 27.4% | 89.9% | 16.2 | 11.7 | 1.68 | 60.0% | 4.05% |
| HSY NYSE Hershey |
41.8B | -7.09% | 31.2% | 46.3% | 47.6 | 24.8 | 1.18 | -47.3% | -9.92% |
| HLF NYSE Herbalife Nutrition |
1.44B | -16.5% | 79.4% | -68.9% | 6.31 | 5.18 | 0.61 | -66.1% | -54.3% |
| TGT NYSE Target |
54.5B | -0.52% | 32.5% | -32.7% | 14.8 | 15.1 | 3.42 | 34.6% | 2.92% |
| VIS MC Viscofan |
3.18B | 3.38% | -0.01% | 19.8% | 17.3 | 17.7 | 2.16 | 21.0% | 16.9% |
Performance: PM vs S&P 500
Total Return vs S&P 500
| PERIOD | PM | S&P 500 |
|---|---|---|
| 1 Week | -4.75% | 1.37% |
| 1 Month | -8.29% | -2.54% |
| 3 Months | 2.41% | -4.14% |
| 6 Months | 3.75% | -0.92% |
| 12 Months | 7.83% | 32.20% |
| 5 Years | 119.29% | 71.53% |
PM Performance FAQ
Does PM outperform the market?
No, PM underperforms the market. Over the past 12 months, PM returned 7.83% compared to 32.20% for the S&P 500.
What is the PM return over the last 12 months?
PM has returned 7.83% over the past 12 months, including dividends. Over 3 months the return was 2.41%, and over 5 years 119.29%.
How risky is PM?
PM has relatively low risk with a maximum drawdown of 20.64% over the past 3 years. The average drawdown is 5.41%.
PM vs Sectors (12m)
Sorted by outperformance. Positive = PM beats sector.
Relative Performance vs S&P Sectors
| SECTOR | ETF | DIFFERENCE 12M |
|---|---|---|
| Consumer Staples | XLP | 0.2% |
| Health Care | XLV | -3.1% |
| Real Estate | XLRE | -5.7% |
| Financials | XLF | -7.1% |
| Consumer Discretionary | XLY | -12.4% |
| Communication Services | XLC | -21.8% |
| Communication Services | XLC | -21.8% |
| Materials | XLB | -25.4% |
| Industrials | XLI | -34% |
| Technology | XLK | -42.9% |
| Energy | XLE | -50.9% |
PM vs Asset Classes (12m)
Relative Performance vs Major Asset Classes
| ASSET CLASS | ETF | DIFFERENCE 12M |
|---|---|---|
| S&P 500 | SPY | -18.43% |
| Gold | GLD | -49.9% |
| Long-Term Bonds | TLT | 7.3% |