UNP Performance: 11.8% Return (12 Months)
UNP returned 11.8% over 12 months, underperforming the S&P 500 (23.6%). Volatility: 20.7%.
| P/E Trailing | 20.3 |
| P/E Forward | 19.5 |
| 52 Week High | 266.97 USD |
| 52 Week Low | 203.47 USD |
| VRO Trend Strength ±100 | 32.37 |
| Buy Signal ±3 | 0.29 |
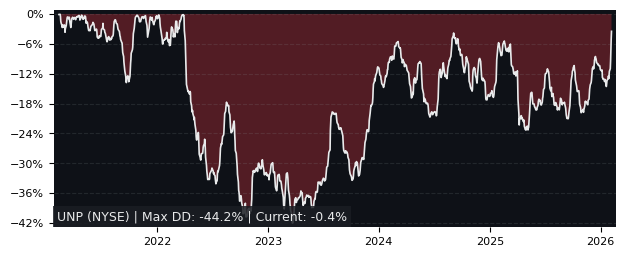
| Max Drawdown | 17.75% |
| Mean Drawdown | 6.60% |
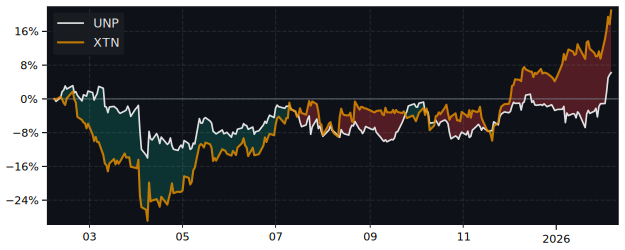
Top Performer in Ground Transportation (5/30)
| SYMBOL | 1W | 1M | 3M |
|---|---|---|---|
| CAR | 28.27% | 96.35% | 47.42% |
| NMM | 6.41% | -2.32% | 35.95% |
| GET | 9.99% | 7.08% | 21.29% |
| MRTN | 6.83% | 2.37% | 13.45% |
| UNP | 2.48% | -7.95% | 6.04% |
| HTZ | 11.09% | 17.74% | -2.48% |
| SYMBOL | 6M | 12M | 5Y |
|---|---|---|---|
| CAR | 23.20% | 162.25% | 167.23% |
| NMM | 55.29% | 98.92% | 215.82% |
| JBHT | 56.51% | 59.49% | 31.54% |
| ARCB | 40.05% | 57.46% | 39.70% |
| KNX | 42.48% | 50.32% | 24.84% |
| UNP | 4.49% | 11.84% | 22.54% |
| SYMBOL | MCAP | 1M | 12M | 5Y | P/E | P/E fwd | PEG | EPS stab | EPS cagr |
|---|---|---|---|---|---|---|---|---|---|
| NMM NYSE Navios Maritime Partners |
1.88B | -2.32% | 98.9% | 216% | 6.81 | 8.56 | 2.18 | -55.3% | -50.5% |
| R NYSE Ryder System |
7.79B | -3.31% | 51.6% | 198% | 16.5 | 23.1 | 0.86 | -50.6% | -50.4% |
| CSX NASDAQ CSX |
74.0B | -3.38% | 49.5% | 34.2% | 25.8 | 20.6 | 3.24 | -68.4% | -49.4% |
| GET PA Getlink SE |
11.1B | 7.08% | 23.0% | 63.8% | 29.9 | 31.5 | 0.55 | -6.90% | - |
| ODFL NASDAQ Old Dominion Freight Line |
39.4B | -4.65% | 28.0% | 64.8% | 38.9 | 35.8 | 2.54 | -90.2% | -20.7% |
Performance: UNP vs S&P 500
| PERIOD | UNP | S&P 500 | DIFFERENCE |
|---|---|---|---|
| 1 Month | -7.95% | -3.34% | -4.77% |
| 3 Months | 6.04% | -4.38% | 10.90% |
| 6 Months | 4.49% | -1.44% | 6.02% |
| 12 Months | 11.84% | 23.60% | -9.52% |
| 5 Years | 22.54% | 72.80% | -29.09% |
UNP Performance FAQ
Does UNP outperform the market?
No, UNP underperforms the market. Over the past 12 months, UNP returned 11.84% compared to 23.60% for the S&P 500.
What is the UNP return over the last 12 months?
UNP has returned 11.84% over the past 12 months, including dividends. Over 3 months the return was 6.04%, and over 5 years 22.54%.
How risky is UNP?
UNP has relatively low risk with a maximum drawdown of 17.75% over the past 3 years. The average drawdown is 6.60%.
UNP vs Sectors (12m)
Sorted by outperformance. Positive = UNP beats sector.
| SECTOR | ETF | DIFFERENCE 12M |
|---|---|---|
| Consumer Staples | XLP | 9.2% |
| Health Care | XLV | 7.4% |
| Financials | XLF | 6.4% |
| Real Estate | XLRE | 6.4% |
| Consumer Discretionary | XLY | -2.3% |
| Consumer Discretionary | XLY | -2.3% |
| Communication Services | XLC | -10.4% |
| Materials | XLB | -11.9% |
| Industrials | XLI | -20% |
| Technology | XLK | -28.3% |
| Energy | XLE | -29.2% |
UNP vs Asset Classes (12m)
| ASSET CLASS | ETF | DIFFERENCE 12M |
|---|---|---|
| S&P 500 | SPY | -9.52% |
| Gold | GLD | -38.1% |
| Long-Term Bonds | TLT | 13.1% |