BSP Performance: 38.2% Return (12 Months)
BSP returned 38.2% over 12 months, outperforming the S&P 500 (23.6%). Volatility: 34.9%.
RS (IBD)
57.65
Top 37% in Peers
Volatility
34.9%
Top 32% in Peers
Total Return 12m
38.21%
Top 54% in Peers
RS Rating
77.96
Top 37% in Peers
| P/E | Value |
|---|---|
| P/E Trailing | 30.2 |
| P/E Forward | 25.1 |
| High / Low | EUR |
|---|---|
| 52 Week High | 27.11 EUR |
| 52 Week Low | 17.27 EUR |
| Sentiment | Value |
|---|---|
| VRO Trend Strength +-100 | 48.61 |
| Buy Signal +-3 | -0.05 |
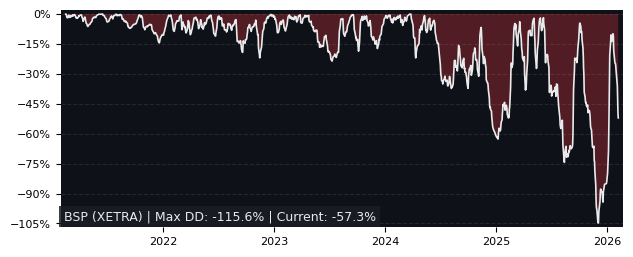
| Drawdowns | in 3y |
|---|---|
| Max Drawdown | 23.20% |
| Mean Drawdown | 6.17% |
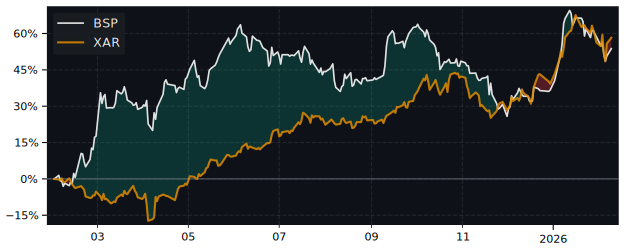
Peer Group: Aerospace & Defense (48 symbols)
12m Total Return: BSP (38.2%) vs SPY (23.6%)
5y Drawdown (Underwater) Chart
Top Performer in Aerospace & Defense (5/48)
Short Term Performance
| Symbol | 1w | 1m | 3m |
|---|---|---|---|
| BSP | 10.40% | 3.91% | 22.92% |
| ESLT | 2.20% | 8.01% | 41.51% |
| EXA | 17.08% | 6.23% | 35.99% |
| NPK | 2.68% | 4.23% | 29.43% |
| DRS | 3.26% | 1.93% | 25.34% |
| PKE | 3.00% | -1.13% | 27.57% |
Long Term Performance
| Symbol | 6m | 12m | 5y |
|---|---|---|---|
| BSP | 12.61% | 38.21% | 390.35% |
| EXA | 35.03% | 244.56% | 1008.68% |
| ATRO | 47.87% | 194.06% | 277.31% |
| ESLT | 73.11% | 129.17% | 550.03% |
| PKE | 44.66% | 127.11% | 156.08% |
| DCO | 34.01% | 127.02% | 97.18% |
Overall best picks of Peer Group (GARP Metrics)
| Symbol | Market Cap | 1m | 12m | 5y | P/E | P/E Forward | PEG | EPS Stability | EPS CAGR |
|---|---|---|---|---|---|---|---|---|---|
| BSP XETRA BAE Systems |
81.2B | 3.91% | 38.2% | 390% | 30.2 | 25.1 | 3.50 | - | - |
| LMT NYSE Lockheed Martin |
142B | -6.74% | 40.7% | 88.2% | 28.7 | 20.5 | 1.31 | -30.6% | -2.75% |
Performance: BSP vs S&P 500
| Total Return | BSP | S&P 500 | Difference |
|---|---|---|---|
| 1 Month | 3.91% | -3.34% | 7.49% |
| 3 Months | 22.92% | -4.38% | 28.6% |
| 6 Months | 12.61% | -1.44% | 14.3% |
| 12 Months | 38.21% | 23.60% | 11.8% |
| 5 Years | 390.35% | 72.80% | 184% |
FAQs
Does BSP outperform the market?
Yes, BSP significantly outperforms the market.
Over the past 12 months, BSP returned 38.21% compared to 23.60% for the S&P 500.
What is the BSP return over the last 12 months?
BSP has returned 38.21% over the past 12 months, including dividends.
Over 3 months the return was 22.92%, and over 5 years 390.35%.
How risky is BSP?
BSP has relatively low risk with a maximum drawdown of 23.20% over the past 3 years.
The average drawdown is 6.17%.
BSP vs Sectors (12m)
Sorted by outperformance. Positive = BSP beats sector.
| Sector | ETF | Difference |
|---|---|---|
| Consumer Staples | XLP | 35.6% |
| Health Care | XLV | 33.8% |
| Financials | XLF | 32.8% |
| Real Estate | XLRE | 32.7% |
| Consumer Discretionary | XLY | 24.1% |
| Consumer Discretionary | XLY | 24.1% |
| Communication Services | XLC | 16.0% |
| Materials | XLB | 14.5% |
| Industrials | XLI | 6.33% |
| Technology | XLK | -1.90% |
| Energy | XLE | -2.79% |
BSP vs Asset Classes (12m)
| Asset Class | ETF | Difference |
|---|---|---|
| S&P 500 | SPY | 11.8% |
| Gold | GLD | -11.7% |
| Long-Term Bonds | TLT | 39.4% |