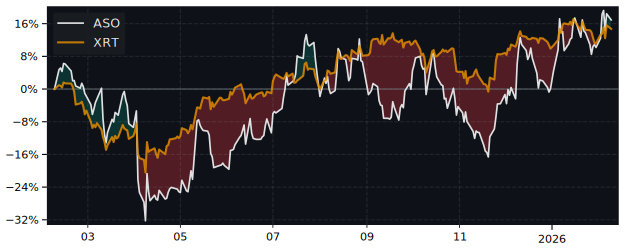
ASO Performance: 59.3% Return (12 Months)
ASO returned 59.3% over 12 months, outperforming the S&P 500 (31.5%). Volatility: 42.3%.
| P/E Trailing | 10.4 |
| P/E Forward | 9.13 |
| 52 Week High | 61.02 USD |
| 52 Week Low | 33.73 USD |
| VRO Trend Strength ±100 | 55.03 |
| Buy Signal ±3 | -0.08 |
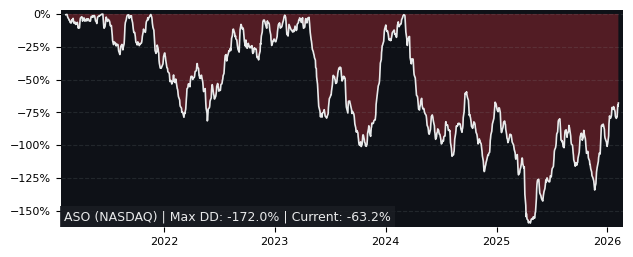
| Max Drawdown | 54.17% |
| Mean Drawdown | 26.00% |
Top Performer in Other Specialty Retail (5/15)
| SYMBOL | 1W | 1M | 3M |
|---|---|---|---|
| ELA | 3.92% | 31.98% | 37.15% |
| FIVE | 7.08% | 6.20% | 19.71% |
| HZO | 5.07% | -4.16% | 10.54% |
| ASO | 5.68% | -4.76% | 5.08% |
| WOOF | 0.00% | 9.39% | -9.76% |
| CHWY | 3.83% | 3.07% | -16.42% |
| SYMBOL | 6M | 12M | 5Y |
|---|---|---|---|
| FIVE | 53.18% | 286.65% | 18.20% |
| ELA | 140.72% | 185.48% | 237.84% |
| EYE | -15.84% | 108.72% | -47.81% |
| ASO | 6.64% | 59.32% | 87.31% |
| ULTA | -5.21% | 56.71% | 68.06% |
| HZO | 3.19% | 47.02% | -44.92% |
Performance: ASO vs S&P 500
| PERIOD | ASO | S&P 500 | DIFFERENCE |
|---|---|---|---|
| 1 Month | -4.76% | -3.48% | -1.33% |
| 3 Months | 5.08% | -4.38% | 9.89% |
| 6 Months | 6.64% | -1.79% | 8.59% |
| 12 Months | 59.32% | 31.52% | 21.13% |
| 5 Years | 87.31% | 72.80% | 8.39% |
ASO Performance FAQ
Does ASO outperform the market?
Yes, ASO significantly outperforms the market. Over the past 12 months, ASO returned 59.32% compared to 31.52% for the S&P 500.
What is the ASO return over the last 12 months?
ASO has returned 59.32% over the past 12 months, including dividends. Over 3 months the return was 5.08%, and over 5 years 87.31%.
How risky is ASO?
ASO has relatively low risk with a maximum drawdown of 54.17% over the past 3 years. The average drawdown is 26.00%.
ASO vs Sectors (12m)
Sorted by outperformance. Positive = ASO beats sector.
| SECTOR | ETF | DIFFERENCE 12M |
|---|---|---|
| Consumer Staples | XLP | 50.8% |
| Health Care | XLV | 48.2% |
| Real Estate | XLRE | 46.1% |
| Financials | XLF | 45.3% |
| Consumer Discretionary | XLY | 38.6% |
| Communication Services | XLC | 29.9% |
| Communication Services | XLC | 29.9% |
| Materials | XLB | 25.2% |
| Industrials | XLI | 17.9% |
| Technology | XLK | 10.2% |
| Energy | XLE | 3% |
ASO vs Asset Classes (12m)
| ASSET CLASS | ETF | DIFFERENCE 12M |
|---|---|---|
| S&P 500 | SPY | 21.13% |
| Gold | GLD | 2.4% |
| Long-Term Bonds | TLT | 58.6% |