DORM Performance: -5.8% Return (12 Months)
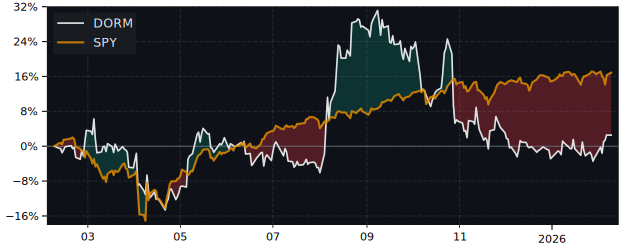
DORM returned -5.8% over 12 months, underperforming the S&P 500 (37.7%). Volatility: 38.8%.
| P/E Trailing | 15.3 |
| P/E Forward | 12.2 |
| 52 Week High | 166.34 USD |
| 52 Week Low | 100.50 USD |
| VRO Trend Strength ±100 | 47.98 |
| Buy Signal ±3 | -0.52 |
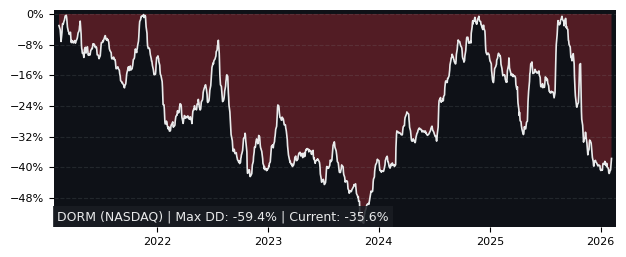
| Max Drawdown | 39.58% |
| Mean Drawdown | 10.92% |
Top Performer in Automotive Parts & Equipment (5/36)
| SYMBOL | 1W | 1M | 3M |
|---|---|---|---|
| MOD | 5.32% | 16.80% | 95.70% |
| DAN | 3.20% | 7.95% | 33.25% |
| BWA | 0.71% | 3.21% | 15.34% |
| PHIN | 4.51% | 8.50% | 7.51% |
| DORM | 0.93% | -1.44% | -17.24% |
| WRD | -1.27% | 23.85% | -20.27% |
| SYMBOL | 6M | 12M | 5Y |
|---|---|---|---|
| DAN | 92.14% | 248.38% | 51.01% |
| MOD | 51.96% | 226.98% | 1431.90% |
| CPS | -7.92% | 176.16% | -6.52% |
| GTX | 47.41% | 144.41% | 286.76% |
| BWA | 29.21% | 124.43% | 41.13% |
| DORM | -25.93% | -5.82% | 0.46% |
| SYMBOL | MCAP | 1M | 12M | 5Y | P/E | P/E fwd | PEG | EPS stab | EPS cagr |
|---|---|---|---|---|---|---|---|---|---|
| GTX NASDAQ Garrett Motion |
3.58B | 3.25% | 144% | 287% | 12.1 | 10.6 | - | 33.8% | 30.3% |
| MOD NYSE Modine Manufacturing |
11.3B | 16.8% | 227% | 1,432% | 118 | 30.5 | 0.90 | 31.5% | -33.7% |
| LCII NYSE LCI Industries |
2.95B | -0.52% | 76.5% | 10.6% | 16.0 | 14.2 | 1.04 | -10.5% | -43.4% |
| XPEL NASDAQ Xpel |
1.22B | 12.2% | 81.0% | -24.8% | 23.9 | - | - | -26.2% | -46.7% |
Performance: DORM vs S&P 500
| PERIOD | DORM | S&P 500 |
|---|---|---|
| 1 Week | 0.93% | 3.17% |
| 1 Month | -1.44% | -0.06% |
| 3 Months | -17.24% | -1.69% |
| 6 Months | -25.93% | 1.00% |
| 12 Months | -5.82% | 37.72% |
| 5 Years | 0.46% | 75.84% |
DORM Performance FAQ
Does DORM outperform the market?
No, DORM underperforms the market. Over the past 12 months, DORM returned -5.82% compared to 37.72% for the S&P 500.
What is the DORM return over the last 12 months?
DORM has returned -5.82% over the past 12 months, including dividends. Over 3 months the return was -17.24%, and over 5 years 0.46%.
How risky is DORM?
DORM has relatively low risk with a maximum drawdown of 39.58% over the past 3 years. The average drawdown is 10.92%.
DORM vs Sectors (12m)
Sorted by outperformance. Positive = DORM beats sector.
| SECTOR | ETF | DIFFERENCE 12M |
|---|---|---|
| Consumer Staples | XLP | -17.2% |
| Health Care | XLV | -20.4% |
| Financials | XLF | -24.2% |
| Real Estate | XLRE | -24.3% |
| Consumer Discretionary | XLY | -32.5% |
| Consumer Discretionary | XLY | -32.5% |
| Communication Services | XLC | -39.6% |
| Materials | XLB | -47.9% |
| Industrials | XLI | -54.2% |
| Energy | XLE | -62.6% |
| Technology | XLK | -64.4% |
DORM vs Asset Classes (12m)
| ASSET CLASS | ETF | DIFFERENCE 12M |
|---|---|---|
| S&P 500 | SPY | -43.5% |
| Emerging Market | EEM | -66.5% |
| Gold | GLD | -63.7% |
| Long-Term Bonds | TLT | -8.7% |
| Risk-Free Cash | SHY | -9.3% |