LPLA Performance: 8.7% Return (12 Months)
LPLA returned 8.7% over 12 months, underperforming the S&P 500 (37.7%). Volatility: 39.0%.
| P/E Trailing | 26.9 |
| P/E Forward | 10.9 |
| 52 Week High | 397.96 USD |
| 52 Week Low | 284.05 USD |
| VRO Trend Strength ±100 | 55.02 |
| Buy Signal ±3 | 0.35 |
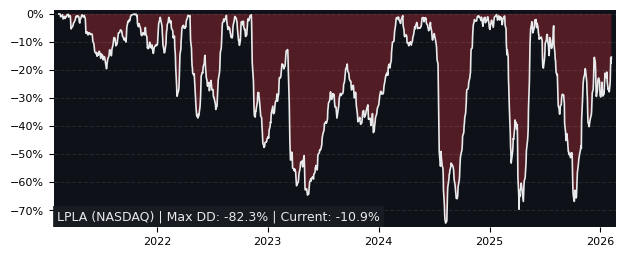
| Max Drawdown | 33.18% |
| Mean Drawdown | 8.30% |
Top Performer in Investment Banking & Brokerage (5/27)
| SYMBOL | 1W | 1M | 3M |
|---|---|---|---|
| VIRT | 10.25% | 16.69% | 51.32% |
| SNEX | 13.45% | 26.04% | 33.21% |
| MRX | 13.75% | 36.50% | 28.51% |
| BGC | 10.47% | 14.42% | 23.50% |
| FRHC | 6.38% | 18.96% | 15.72% |
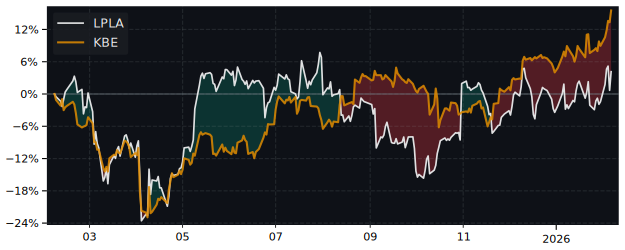
| LPLA | 7.44% | -0.55% | -14.15% |
| SYMBOL | 6M | 12M | 5Y |
|---|---|---|---|
| BMNR | -64.12% | 226.15% | -86.91% |
| GS | 17.84% | 100.02% | 207.79% |
| SNEX | 36.71% | 96.75% | 369.22% |
| VIRT | 50.90% | 52.75% | 88.11% |
| MRX | 56.62% | 36.38% | 165.80% |
| LPLA | -4.24% | 8.70% | 114.71% |
| SYMBOL | MCAP | 1M | 12M | 5Y | P/E | P/E fwd | PEG | EPS stab | EPS cagr |
|---|---|---|---|---|---|---|---|---|---|
| VIRT NYSE Virtu Financial |
10.2B | 16.7% | 52.8% | 88.1% | 9.29 | 9.81 | -9.42 | 53.0% | 10.6% |
| IBKR NASDAQ Interactive Brokers |
117B | 7.14% | 97.4% | 292% | 30.9 | 29.9 | 2.40 | 96.4% | 35.2% |
| MRX NASDAQ Marex Ordinary Shares |
3.15B | 36.5% | 36.4% | 166% | 11.4 | 8.76 | - | -27.1% | -66.3% |
| FUTU NASDAQ Futu Holdings |
19.6B | 9.69% | 109% | 8.27% | 13.8 | 13.9 | - | 8.10% | -39.8% |
Performance: LPLA vs S&P 500
| PERIOD | LPLA | S&P 500 |
|---|---|---|
| 1 Week | 7.44% | 3.17% |
| 1 Month | -0.55% | -0.06% |
| 3 Months | -14.15% | -1.69% |
| 6 Months | -4.24% | 1.00% |
| 12 Months | 8.70% | 37.72% |
| 5 Years | 114.71% | 75.84% |
LPLA Performance FAQ
Does LPLA outperform the market?
No, LPLA underperforms the market. Over the past 12 months, LPLA returned 8.70% compared to 37.72% for the S&P 500.
What is the LPLA return over the last 12 months?
LPLA has returned 8.70% over the past 12 months, including dividends. Over 3 months the return was -14.15%, and over 5 years 114.71%.
How risky is LPLA?
LPLA has relatively low risk with a maximum drawdown of 33.18% over the past 3 years. The average drawdown is 8.30%.
LPLA vs Sectors (12m)
Sorted by outperformance. Positive = LPLA beats sector.
| SECTOR | ETF | DIFFERENCE 12M |
|---|---|---|
| Consumer Staples | XLP | -2.7% |
| Health Care | XLV | -5.9% |
| Financials | XLF | -9.7% |
| Real Estate | XLRE | -9.7% |
| Consumer Discretionary | XLY | -18% |
| Consumer Discretionary | XLY | -18% |
| Communication Services | XLC | -25.1% |
| Materials | XLB | -33.4% |
| Industrials | XLI | -39.7% |
| Energy | XLE | -48.1% |
| Technology | XLK | -49.9% |
LPLA vs Asset Classes (12m)
| ASSET CLASS | ETF | DIFFERENCE 12M |
|---|---|---|
| S&P 500 | SPY | -21.08% |
| Gold | GLD | -49.2% |
| Long-Term Bonds | TLT | 5.9% |