MEDP Performance Analysis - Medpace Holdings | 64% 12M Return
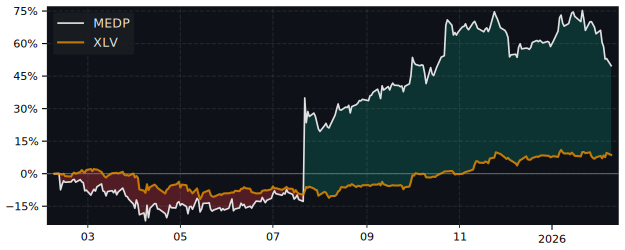
12M Return: 64% | +42% vs S&P 500 | Volatility: 42.3% | Relative Strength, Momentum & Peer Ranking
Detailed Performance Metrics Updated: 2026-07-11 03:55
| CAGR | 30.6% |
| CAGR / Max DD | 0.78 |
| CAGR / Mean DD | 2.08 |
| CAGR / Median DD | 2.46 |
| ATR % | 3.59% |
| Beta | 0.936 |
| Beta Downside | 0.718 |
| Alpha | 46.54% |
| CAPM | 9.27% |
| Current Price | 538.23 USD |
| SMA 20 Distance | -4.47% |
| SMA 50 Distance | -13.94% |
| SMA 200 Distance | -4.33% |
| RSI 14 | 64.6 |
| EMA8 Dist. Percentile | 47.5% |
| Distance to 52W High | -13.75% |
| Hurst Exponent | 0.576 |
| METRIC | MEDP | PERCENTILE RANK |
|---|---|---|
| RS IBD | 61.60 | 53.4 |
| Performance 1M | 15.57% | 56.9 |
| Performance 3M | 9.06% | 25.9 |
| Performance 6M | -10.18% | 36.2 |
| Performance 12M | 63.97% | 74.1 |
| Sharpe Ratio | 0.95 | 70.7 |
Top Performer in Life Sciences Tools & Services 5 of 29 peers
| SYMBOL | 1W | 1M | 3M |
|---|---|---|---|
| PSNL | 3.30% | 46.41% | 133.72% |
| MRVI | 0.83% | 19.88% | 98.37% |
| FTRE | 2.78% | 8.69% | 93.46% |
| TXG | 9.54% | 46.79% | 83.63% |
| GNFT | 6.18% | 62.03% | 58.29% |
| MEDP | -3.47% | 15.57% | 9.06% |
| SYMBOL | 6M | 12M | 5Y |
|---|---|---|---|
| GNFT | 160.47% | 314.35% | 328.04% |
| TXG | 115.81% | 238.59% | -76.43% |
| FTRE | -3.48% | 237.00% | -44.50% |
| MRVI | 54.57% | 110.73% | -83.95% |
| PSNL | 64.18% | 103.32% | -36.82% |
| MEDP | -10.18% | 63.97% | 193.30% |
Overall Best Picks of Peer Group GARP Metrics
| SYMBOL | MCAP | 1M | 12M | 5Y | P/E | P/E fwd | PEG | EPS cagr |
|---|---|---|---|---|---|---|---|---|
| ILMN NASDAQ Illumina |
28.5B | 17.07% | 90.10% | -59.56% | 34.4 | 36.0 | 3.30 | 124.73% |
| TXG NASDAQ 10X Genomics |
4.95B | 46.79% | 238.59% | -76.43% | 0.00 | 667 | - | -% |
| SHC NASDAQ Sotera Health |
5.24B | 13.21% | 54.92% | -21.52% | 42.8 | 17.7 | 1.68 | 9.20% |
| TECH NASDAQ Bio-Techne |
11.1B | 35.81% | 31.84% | -35.43% | 102 | 33.9 | 0.95 | -0.78% |
Compare MEDP vs S&P 500
| PERIOD | MEDP | S&P 500 |
|---|---|---|
| 1 Week | -3.47% | 1.37% |
| 1 Month | 15.57% | 4.34% |
| 3 Months | 9.06% | 11.40% |
| 6 Months | -10.18% | 9.18% |
| 12 Months | 63.97% | 21.97% |
| 5 Years | 193.30% | 85.44% |
FAQ
Yes, MEDP significantly outperforms the market. Over the past 12 months, MEDP returned 63.97% compared to 21.97% for the S&P 500.
MEDP has returned 63.97% over the past 12 months, including dividends. Over 3 months the return was 9.06%, and over 5 years 193.30%.
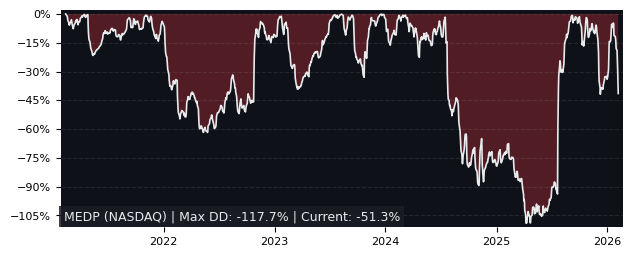
MEDP has relatively low risk with a maximum drawdown of 39.38% over the past 3 years. The average drawdown is 14.70%.
MEDP vs Sectors 12m
| SECTOR | ETF | DIFFERENCE 12M |
|---|---|---|
| Communication Services | XLC | 58% |
| Consumer Staples | XLP | 57.4% |
| Consumer Discretionary | XLY | 57.2% |
| Financials | XLF | 56.6% |
| Real Estate | XLRE | 53.5% |
| Materials | XLB | 51.7% |
| Materials | XLB | 51.7% |
| Health Care | XLV | 43.9% |
| Industrials | XLI | 41.7% |
| Energy | XLE | 36% |
| Technology | XLK | 18.6% |
MEDP vs Asset Classes 12m
| ASSET CLASS | ETF | DIFFERENCE 12M |
|---|---|---|
| S&P 500 | SPY | 42% |
| Emerging Market | EEM | 23.1% |
| Gold | GLD | 40.8% |
| Long-Term Bonds | TLT | 62.4% |
| Risk-Free Cash | SHY | 61% |