TROW Performance: 20.6% Return (12 Months)
TROW returned 20.6% over 12 months, underperforming the S&P 500 (37.7%). Volatility: 25.6%.
| P/E Trailing | 9.76 |
| P/E Forward | 8.95 |
| 52 Week High | 107.41 USD |
| 52 Week Low | 76.16 USD |
| VRO Trend Strength ±100 | 60.77 |
| Buy Signal ±3 | 0.42 |
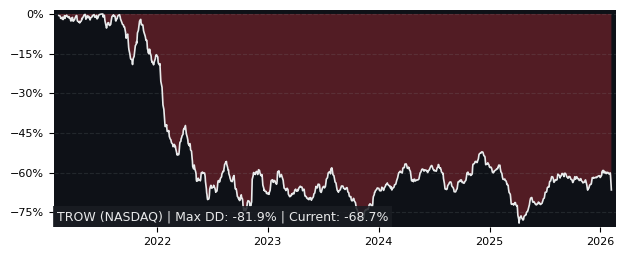
| Max Drawdown | 34.05% |
| Mean Drawdown | 12.10% |
Top Performer in Asset Management & Custody Banks (5/136)
| SYMBOL | 1W | 1M | 3M |
|---|---|---|---|
| WULF | 24.65% | 30.32% | 40.58% |
| SSSS | 6.57% | 33.15% | 29.06% |
| AAMI | 5.75% | 15.49% | 17.11% |
| INV | -6.54% | 31.15% | -3.15% |
| NP | 6.83% | 30.91% | -5.57% |
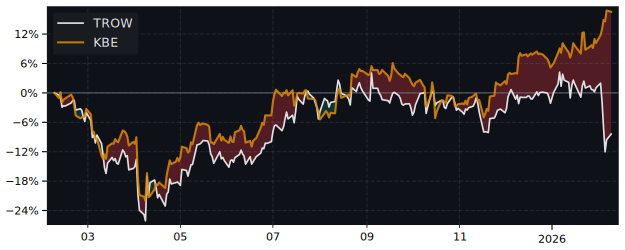
| TROW | 2.16% | 2.90% | -14.18% |
| SYMBOL | 6M | 12M | 5Y |
|---|---|---|---|
| WULF | 46.75% | 698.67% | 104.37% |
| CIFR | -12.39% | 630.81% | 42.38% |
| IREN | -38.71% | 594.91% | 50.63% |
| SII | 63.81% | 270.79% | 305.53% |
| SSSS | 27.88% | 188.15% | 45.92% |
| TROW | -10.87% | 20.55% | -36.82% |
| SYMBOL | MCAP | 1M | 12M | 5Y | P/E | P/E fwd | PEG | EPS stab | EPS cagr |
|---|---|---|---|---|---|---|---|---|---|
| BUI NYSE BlackRock Utility |
646M | -3.44% | 45.1% | 52.2% | 5.85 | - | - | - | - |
| JHG NYSE Janus Henderson |
7.93B | 0.74% | 80.4% | 99.2% | 9.85 | 11.8 | 1.06 | 28.4% | -45.0% |
| HQL NYSE Tekla Life Sciences |
498M | 5.77% | 80.3% | 53.0% | 6.04 | - | - | -2.20% | 100% |
| AAMI NYSE Acadian Asset Management |
1.97B | 15.5% | 155% | 157% | 25.0 | 12.7 | - | 57.1% | 28.2% |
| BGR NYSE BlackRock Energy Resources |
421M | 3.25% | 57.5% | 156% | 10.5 | - | - | -19.2% | -63.1% |
| BSTZ NYSE BlackRock Science |
1.54B | 11.9% | 63.4% | 4.56% | 4.82 | - | - | -73.7% | -46.0% |
| HQH NYSE Tekla Healthcare Investors |
1.02B | 2.13% | 50.2% | 33.5% | 11.4 | - | - | -11.9% | 27.5% |
| MEGI NYSE MainStay CBRE Global |
764M | 2.16% | 43.1% | 16.3% | 7.12 | - | - | 89.4% | 5,694% |
| IQI NYSE Quality Municipal Income |
503M | -1.57% | 16.2% | 0.16% | - | - | - | -38.6% | -19.3% |
| RVT NYSE Royce Value |
2.07B | 4.10% | 52.5% | 44.8% | 5.83 | - | - | -10.8% | -80.9% |
Performance: TROW vs S&P 500
| PERIOD | TROW | S&P 500 |
|---|---|---|
| 1 Week | 2.16% | 3.17% |
| 1 Month | 2.90% | -0.06% |
| 3 Months | -14.18% | -1.69% |
| 6 Months | -10.87% | 1.00% |
| 12 Months | 20.55% | 37.72% |
| 5 Years | -36.82% | 75.84% |
TROW Performance FAQ
Does TROW outperform the market?
No, TROW underperforms the market. Over the past 12 months, TROW returned 20.55% compared to 37.72% for the S&P 500.
What is the TROW return over the last 12 months?
TROW has returned 20.55% over the past 12 months, including dividends. Over 3 months the return was -14.18%, and over 5 years -36.82%.
How risky is TROW?
TROW has relatively low risk with a maximum drawdown of 34.05% over the past 3 years. The average drawdown is 12.10%.
TROW vs Sectors (12m)
Sorted by outperformance. Positive = TROW beats sector.
| SECTOR | ETF | DIFFERENCE 12M |
|---|---|---|
| Consumer Staples | XLP | 9.1% |
| Health Care | XLV | 6% |
| Financials | XLF | 2.2% |
| Real Estate | XLRE | 2.1% |
| Consumer Discretionary | XLY | -6.1% |
| Consumer Discretionary | XLY | -6.1% |
| Communication Services | XLC | -13.2% |
| Materials | XLB | -21.5% |
| Industrials | XLI | -27.8% |
| Energy | XLE | -36.2% |
| Technology | XLK | -38% |
TROW vs Asset Classes (12m)
| ASSET CLASS | ETF | DIFFERENCE 12M |
|---|---|---|
| S&P 500 | SPY | -12.47% |
| Gold | GLD | -37.4% |
| Long-Term Bonds | TLT | 17.7% |