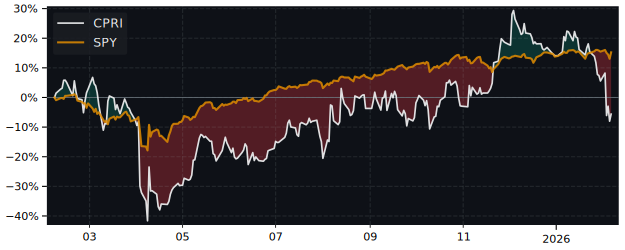
CPRI Performance: 19.8% Return (12 Months)
CPRI returned 19.8% over 12 months, in line with the S&P 500 (23.6%). Volatility: 50.5%.
| P/E Trailing | 0.00 |
| P/E Forward | 16.2 |
| 52 Week High | 27.66 USD |
| 52 Week Low | 12.48 USD |
| VRO Trend Strength ±100 | 20.13 |
| Buy Signal ±3 | -0.56 |
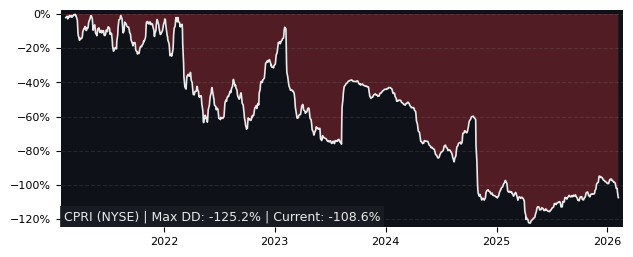
| Max Drawdown | 76.85% |
| Mean Drawdown | 39.22% |
Top Performer in Apparel, Accessories & Luxury Goods (5/28)
| SYMBOL | 1W | 1M | 3M |
|---|---|---|---|
| FOSL | 16.83% | 8.14% | 22.69% |
| MOV | 0.26% | -1.62% | 15.59% |
| OXM | 13.42% | 1.47% | 13.12% |
| PVH | 16.13% | 15.92% | 12.81% |
| SFER | 9.84% | 17.07% | -13.64% |
| CPRI | 4.00% | -5.32% | -27.20% |
| SYMBOL | 6M | 12M | 5Y |
|---|---|---|---|
| FOSL | 79.54% | 334.58% | -63.39% |
| TPR | 23.63% | 120.07% | 275.46% |
| RL | 8.72% | 77.92% | 213.16% |
| MOV | 25.14% | 76.45% | 12.40% |
| ZGN | 1.74% | 65.61% | 13.37% |
| CPRI | -16.54% | 19.81% | -64.22% |
| SYMBOL | MCAP | 1M | 12M | 5Y | P/E | P/E fwd | PEG | EPS stab | EPS cagr |
|---|---|---|---|---|---|---|---|---|---|
| TPR NYSE Tapestry |
28.4B | -8.32% | 120% | 275% | 53.8 | 19.6 | 0.32 | 66.8% | 55.7% |
| RL NYSE Ralph Lauren |
20.9B | -3.30% | 77.9% | 213% | 23.4 | 22.0 | 2.32 | 68.5% | 96.9% |
| ZGN NYSE Ermenegildo Zegna |
2.64B | -4.26% | 65.6% | 13.4% | 22.4 | 21.9 | - | 5.30% | -2.86% |
| KER PA Kering |
37.4B | 4.33% | 53.3% | -49.2% | - | 35.7 | 1.03 | -27.4% | -69.2% |
Performance: CPRI vs S&P 500
| PERIOD | CPRI | S&P 500 | DIFFERENCE |
|---|---|---|---|
| 1 Month | -5.32% | -3.34% | -2.05% |
| 3 Months | -27.20% | -4.38% | -23.87% |
| 6 Months | -16.54% | -1.44% | -15.32% |
| 12 Months | 19.81% | 23.60% | -3.06% |
| 5 Years | -64.22% | 72.80% | -79.30% |
CPRI Performance FAQ
Does CPRI outperform the market?
CPRI performs roughly in line with the market. Over the past 12 months, CPRI returned 19.81% compared to 23.60% for the S&P 500.
What is the CPRI return over the last 12 months?
CPRI has returned 19.81% over the past 12 months, including dividends. Over 3 months the return was -27.20%, and over 5 years -64.22%.
How risky is CPRI?
CPRI has relatively low risk with a maximum drawdown of 76.85% over the past 3 years. The average drawdown is 39.22%.
CPRI vs Sectors (12m)
Sorted by outperformance. Positive = CPRI beats sector.
| SECTOR | ETF | DIFFERENCE 12M |
|---|---|---|
| Consumer Staples | XLP | 17.2% |
| Health Care | XLV | 15.4% |
| Financials | XLF | 14.4% |
| Real Estate | XLRE | 14.3% |
| Consumer Discretionary | XLY | 5.7% |
| Consumer Discretionary | XLY | 5.7% |
| Communication Services | XLC | -2.4% |
| Materials | XLB | -3.9% |
| Industrials | XLI | -12.1% |
| Technology | XLK | -20.3% |
| Energy | XLE | -21.2% |
CPRI vs Asset Classes (12m)
| ASSET CLASS | ETF | DIFFERENCE 12M |
|---|---|---|
| S&P 500 | SPY | -3.06% |
| Gold | GLD | -30.1% |
| Long-Term Bonds | TLT | 21% |