FERG Performance: 57.4% Return (12 Months)
FERG returned 57.4% over 12 months, outperforming the S&P 500 (32.2%). Volatility: 29.8%.
| P/E Trailing | 23.1 |
| P/E Forward | 19.3 |
| 52 Week High | 266.37 USD |
| 52 Week Low | 145.78 USD |
| VRO Trend Strength ±100 | 34.56 |
| Buy Signal ±3 | -0.22 |
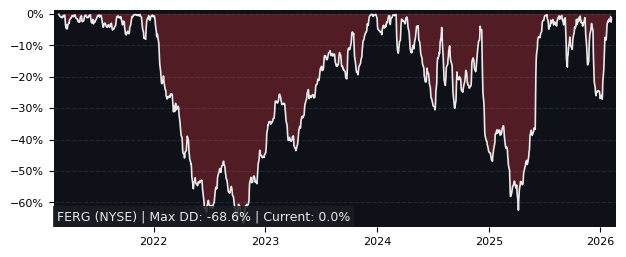
| Max Drawdown | 32.92% |
| Mean Drawdown | 7.24% |
Top Performer in Trading Companies & Distributors (5/31)
| SYMBOL | 1W | 1M | 3M |
|---|---|---|---|
| DXPE | 3.34% | 4.91% | 36.78% |
| TRNS | 2.82% | 5.06% | 25.43% |
| RUSHA | 1.19% | 2.76% | 19.23% |
| IMCD | 0.02% | 27.27% | 15.57% |
| FERG | 1.14% | 2.32% | 6.73% |
| DSGR | 1.30% | 23.80% | -7.93% |
| SYMBOL | 6M | 12M | 5Y |
|---|---|---|---|
| FTAI | 41.60% | 169.71% | 1062.85% |
| WCC | 30.65% | 104.91% | 228.45% |
| DXPE | 21.34% | 97.38% | 373.44% |
| CTOS | 7.10% | 83.43% | -32.11% |
| RXL | 21.64% | 71.30% | 143.50% |
| FERG | 2.92% | 57.42% | 104.15% |
| SYMBOL | MCAP | 1M | 12M | 5Y | P/E | P/E fwd | PEG | EPS stab | EPS cagr |
|---|---|---|---|---|---|---|---|---|---|
| DXPE NASDAQ DXP Enterprises |
2.25B | 4.91% | 97.4% | 373% | 26.6 | 13.6 | 0.55 | 75.1% | 22.5% |
| GWW NYSE WW Grainger |
52.5B | -0.64% | 21.0% | 191% | 31.3 | 25.4 | 1.90 | 79.0% | 8.01% |
| GIC NYSE Global Industrial |
1.21B | -0.50% | 52.9% | -15.4% | 17.0 | 15.3 | 0.96 | -42.0% | -51.5% |
| MSM NYSE MSC Industrial Direct |
5.04B | 0.62% | 34.8% | 21.8% | 24.3 | 21.3 | 2.27 | -86.0% | -19.2% |
| FAST NASDAQ Fastenal |
53.2B | -2.48% | 29.2% | 106% | 42.5 | 38.3 | 3.34 | -77.6% | -14.6% |
Performance: FERG vs S&P 500
| PERIOD | FERG | S&P 500 | DIFFERENCE |
|---|---|---|---|
| 1 Month | 2.32% | -2.54% | 4.99% |
| 3 Months | 6.73% | -4.14% | 11.34% |
| 6 Months | 2.92% | -0.92% | 3.87% |
| 12 Months | 57.42% | 32.20% | 19.08% |
| 5 Years | 104.15% | 71.53% | 19.02% |
FERG Performance FAQ
Does FERG outperform the market?
Yes, FERG significantly outperforms the market. Over the past 12 months, FERG returned 57.42% compared to 32.20% for the S&P 500.
What is the FERG return over the last 12 months?
FERG has returned 57.42% over the past 12 months, including dividends. Over 3 months the return was 6.73%, and over 5 years 104.15%.
How risky is FERG?
FERG has relatively low risk with a maximum drawdown of 32.92% over the past 3 years. The average drawdown is 7.24%.
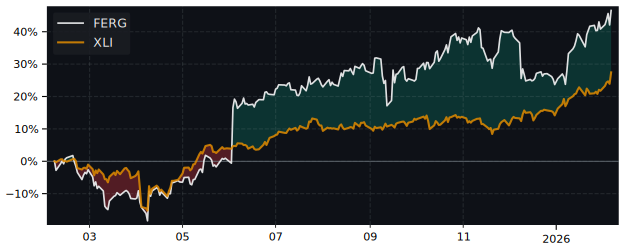
FERG vs Sectors (12m)
Sorted by outperformance. Positive = FERG beats sector.
| SECTOR | ETF | DIFFERENCE 12M |
|---|---|---|
| Consumer Staples | XLP | 49.7% |
| Health Care | XLV | 46.5% |
| Real Estate | XLRE | 43.9% |
| Financials | XLF | 42.5% |
| Consumer Discretionary | XLY | 37.2% |
| Communication Services | XLC | 27.8% |
| Communication Services | XLC | 27.8% |
| Materials | XLB | 24.2% |
| Industrials | XLI | 15.6% |
| Technology | XLK | 6.7% |
| Energy | XLE | -1.3% |
FERG vs Asset Classes (12m)
| ASSET CLASS | ETF | DIFFERENCE 12M |
|---|---|---|
| S&P 500 | SPY | 19.08% |
| Gold | GLD | -0.3% |
| Long-Term Bonds | TLT | 56.8% |