INN Performance: 28.4% Return (12 Months)
INN returned 28.4% over 12 months, underperforming the S&P 500 (37.7%). Volatility: 39.9%.
| P/E Trailing | 0.00 |
| P/E Forward | 40.7 |
| 52 Week High | 5.79 USD |
| 52 Week Low | 3.51 USD |
| VRO Trend Strength ±100 | 73.96 |
| Buy Signal ±3 | -0.51 |
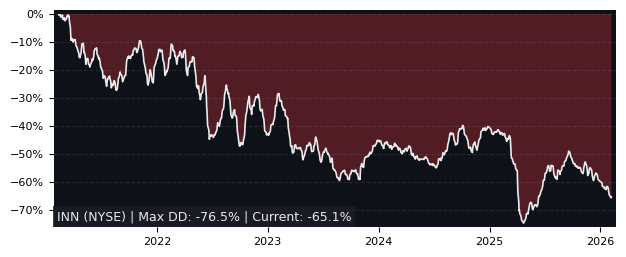
| Max Drawdown | 46.29% |
| Mean Drawdown | 15.49% |
Top Performer in Hotel & Resort REITs (5/11)
| SYMBOL | 1W | 1M | 3M |
|---|---|---|---|
| CLDT | 6.14% | 6.56% | 22.20% |
| PEB | 5.69% | 7.04% | 12.24% |
| HST | 3.19% | 3.97% | 9.39% |
| DRH | 4.27% | 3.95% | 7.58% |
| RHP | 4.78% | 3.36% | 4.24% |
| INN | 5.88% | 8.96% | -2.77% |
| SYMBOL | 6M | 12M | 5Y |
|---|---|---|---|
| PEB | 25.37% | 74.16% | -43.84% |
| XHR | 20.81% | 71.40% | -8.22% |
| HST | 24.98% | 63.85% | 39.71% |
| DRH | 29.67% | 59.21% | 8.85% |
| CLDT | 32.68% | 43.06% | -29.62% |
| INN | -15.80% | 28.37% | -47.18% |
| SYMBOL | MCAP | 1M | 12M | 5Y | P/E | P/E fwd | PEG | EPS stab | EPS cagr |
|---|---|---|---|---|---|---|---|---|---|
| HST NASDAQ Host Hotels & Resorts |
13.3B | 3.97% | 63.9% | 39.7% | 17.4 | 21.1 | 1.14 | 3.30% | 6.13% |
| DRH NYSE Diamondrock Hospitality |
1.93B | 3.95% | 59.2% | 8.85% | 21.3 | 17.4 | 2.52 | 14.8% | 32.6% |
Performance: INN vs S&P 500
| PERIOD | INN | S&P 500 |
|---|---|---|
| 1 Week | 5.88% | 3.17% |
| 1 Month | 8.96% | -0.06% |
| 3 Months | -2.77% | -1.69% |
| 6 Months | -15.80% | 1.00% |
| 12 Months | 28.37% | 37.72% |
| 5 Years | -47.18% | 75.84% |
INN Performance FAQ
Does INN outperform the market?
No, INN underperforms the market. Over the past 12 months, INN returned 28.37% compared to 37.72% for the S&P 500.
What is the INN return over the last 12 months?
INN has returned 28.37% over the past 12 months, including dividends. Over 3 months the return was -2.77%, and over 5 years -47.18%.
How risky is INN?
INN has relatively low risk with a maximum drawdown of 46.29% over the past 3 years. The average drawdown is 15.49%.
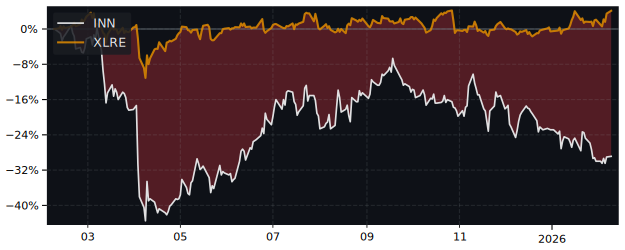
INN vs Sectors (12m)
Sorted by outperformance. Positive = INN beats sector.
| SECTOR | ETF | DIFFERENCE 12M |
|---|---|---|
| Consumer Staples | XLP | 17% |
| Health Care | XLV | 13.8% |
| Financials | XLF | 10% |
| Real Estate | XLRE | 9.9% |
| Consumer Discretionary | XLY | 1.7% |
| Consumer Discretionary | XLY | 1.7% |
| Communication Services | XLC | -5.4% |
| Materials | XLB | -13.7% |
| Industrials | XLI | -20% |
| Energy | XLE | -28.4% |
| Technology | XLK | -30.2% |
INN vs Asset Classes (12m)
| ASSET CLASS | ETF | DIFFERENCE 12M |
|---|---|---|
| S&P 500 | SPY | -6.79% |
| Gold | GLD | -29.5% |
| Long-Term Bonds | TLT | 25.5% |