MS Performance: 57.8% Return (12 Months)
MS returned 57.8% over 12 months, outperforming the S&P 500 (23.6%). Volatility: 30.9%.
RS IBD
35.57
Top 25% in Peers
Volatility
30.9%
Top 28% in Peers
Total Return 12m
57.75%
Top 22% in Peers
RS Rating
64.45
Top 25% in Peers
P/E
| P/E Trailing | 16.3 |
| P/E Forward | 14.4 |
High / Low 52w
| 52 Week High | 190.18 USD |
| 52 Week Low | 97.22 USD |
Sentiment
| VRO Trend Strength ±100 | 22.54 |
| Buy Signal ±3 | 0.04 |
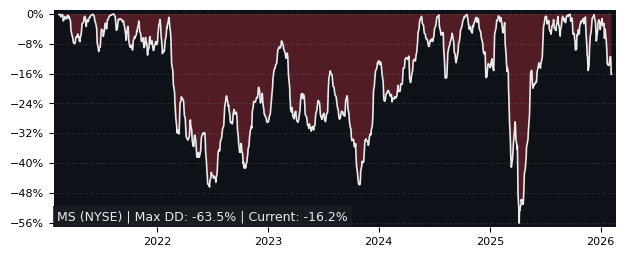
Drawdowns 3y
| Max Drawdown | 29.24% |
| Mean Drawdown | 6.07% |
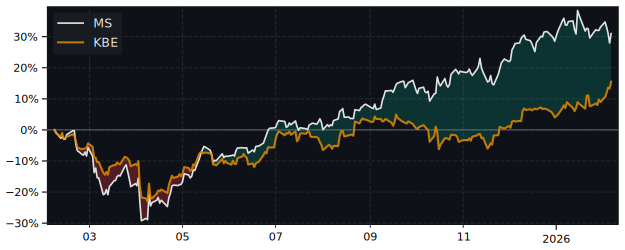
Compare performance with 26 peers in Investment Banking & Brokerage
12m Total Return: MS (57.8%) vs SPY (23.6%)
5y Drawdown (Underwater) Chart
Top Performer in Investment Banking & Brokerage (5/26)
Short Term Performance
| SYMBOL | 1W | 1M | 3M |
|---|---|---|---|
| VIRT | 8.70% | 11.00% | 37.86% |
| SNEX | 7.66% | 0.93% | 24.51% |
| MRX | 2.19% | 6.39% | 11.11% |
| BGC | 6.17% | 3.74% | 9.90% |
| FLOW | 0.80% | 0.00% | 7.32% |
| MS | 4.68% | -0.08% | -10.62% |
Long Term Performance
| SYMBOL | 6M | 12M | 5Y |
|---|---|---|---|
| GS | 10.37% | 72.31% | 200.80% |
| SNEX | 25.23% | 70.49% | 332.70% |
| MS | 6.44% | 57.75% | 149.44% |
| NMR | 12.10% | 46.33% | 78.13% |
| VIRT | 39.12% | 26.60% | 72.86% |
| MRX | 47.71% | 20.31% | 138.28% |
Overall Best Picks of Peer Group (GARP Metrics)
| SYMBOL | MCAP | 1M | 12M | 5Y | P/E | P/E fwd | PEG | EPS stab | EPS cagr |
|---|---|---|---|---|---|---|---|---|---|
| VIRT NYSE Virtu Financial |
9.53B | 11.0% | 26.6% | 72.9% | 8.65 | 9.81 | -9.42 | 53.0% | 10.6% |
| MRX NASDAQ Marex Ordinary Shares |
3.08B | 6.39% | 20.3% | 138% | 11.1 | 8.76 | - | -27.1% | -66.3% |
| SCHW NYSE Charles Schwab |
164B | -1.54% | 26.8% | 46.9% | 19.9 | 15.9 | 1.09 | 42.4% | 17.1% |
| IBKR NASDAQ Interactive Brokers |
115B | -2.39% | 70.5% | 262% | 30.6 | 29.7 | 2.38 | 96.4% | 35.2% |
Performance: MS vs S&P 500
Total Return vs S&P 500
| PERIOD | MS | S&P 500 | DIFFERENCE |
|---|---|---|---|
| 1 Month | -0.08% | -3.34% | 3.37% |
| 3 Months | -10.62% | -4.38% | -6.53% |
| 6 Months | 6.44% | -1.44% | 8.0% |
| 12 Months | 57.75% | 23.60% | 27.6% |
| 5 Years | 149.44% | 72.80% | 44.4% |
FAQs
Does MS outperform the market?
Yes, MS significantly outperforms the market.
Over the past 12 months, MS returned 57.75% compared to 23.60% for the S&P 500.
What is the MS return over the last 12 months?
MS has returned 57.75% over the past 12 months, including dividends.
Over 3 months the return was -10.62%, and over 5 years 149.44%.
How risky is MS?
MS has relatively low risk with a maximum drawdown of 29.24% over the past 3 years.
The average drawdown is 6.07%.
MS vs Sectors (12m)
Sorted by outperformance. Positive = MS beats sector.
| Sector | ETF | Difference |
|---|---|---|
| Consumer Staples | XLP | 55.2% |
| Health Care | XLV | 53.4% |
| Financials | XLF | 52.3% |
| Real Estate | XLRE | 52.3% |
| Consumer Discretionary | XLY | 43.6% |
| Consumer Discretionary | XLY | 43.6% |
| Communication Services | XLC | 35.5% |
| Materials | XLB | 34.0% |
| Industrials | XLI | 25.9% |
| Technology | XLK | 17.6% |
| Energy | XLE | 16.8% |
MS vs Asset Classes (12m)
| Asset Class | ETF | Difference |
|---|---|---|
| S&P 500 | SPY | 27.6% |
| Gold | GLD | 7.83% |
| Long-Term Bonds | TLT | 59.0% |