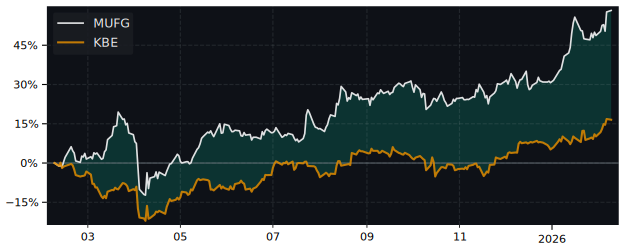
MUFG Performance: 46.4% Return (12 Months)
MUFG returned 46.4% over 12 months, outperforming the S&P 500 (23.6%). Volatility: 32.2%.
| P/E Trailing | 16.7 |
| P/E Forward | 12.1 |
| 52 Week High | 19.73 USD |
| 52 Week Low | 10.65 USD |
| VRO Trend Strength ±100 | 17.07 |
| Buy Signal ±3 | 0.23 |
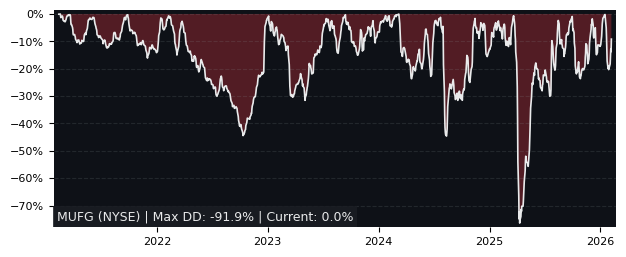
| Max Drawdown | 26.56% |
| Mean Drawdown | 5.02% |
Top Performer in Diversified Banks (5/54)
| SYMBOL | 1W | 1M | 3M |
|---|---|---|---|
| BAP | 5.44% | 2.19% | 16.23% |
| BBT | 3.42% | 1.41% | 13.87% |
| CIB | 4.97% | 10.84% | 10.41% |
| NTB | 4.19% | 5.21% | 7.22% |
| MUFG | 7.04% | -0.17% | 7.17% |
| BSAC | 5.26% | 7.24% | 3.46% |
| SYMBOL | 6M | 12M | 5Y |
|---|---|---|---|
| WF | 18.27% | 103.54% | 250.40% |
| SHG | 23.41% | 99.48% | 138.60% |
| BAP | 27.72% | 89.62% | 176.92% |
| CIB | 40.80% | 76.33% | 296.22% |
| MUFG | 10.91% | 46.40% | 269.03% |
| BMA | 84.90% | 8.97% | 707.95% |
| SYMBOL | MCAP | 1M | 12M | 5Y | P/E | P/E fwd | PEG | EPS stab | EPS cagr |
|---|---|---|---|---|---|---|---|---|---|
| BCH NYSE Banco De Chile |
18.8B | 1.27% | 41.8% | 127% | 14.6 | 27.9 | 9.31 | -65.0% | -4.44% |
| CIB NYSE Grupo Cibest S.A. |
18.1B | 10.8% | 76.3% | 296% | 9.0 | 8.51 | 0.43 | 38.8% | -2.15% |
| BAP NYSE Credicorp |
25.6B | 2.19% | 89.6% | 177% | 13.1 | 12.6 | 4.55 | -73.5% | -49.2% |
| NTB NYSE Bank of N.T. Butterfield |
2.11B | 5.21% | 50.5% | 80.8% | 9.38 | - | 1.96 | -17.4% | -44.9% |
| HBC1 XETRA HSBC Holdings |
278B | 3.28% | 59.2% | 292% | 13.4 | 9.23 | 1.03 | 7.50% | 17.9% |
| BBVA MC Banco Bilbao Vizcaya |
118B | 3.90% | 56.8% | 425% | 10.2 | 9.46 | 1.78 | 90.5% | 16.1% |
Performance: MUFG vs S&P 500
| PERIOD | MUFG | S&P 500 | DIFFERENCE |
|---|---|---|---|
| 1 Month | -0.17% | -3.34% | 3.28% |
| 3 Months | 7.17% | -4.38% | 12.08% |
| 6 Months | 10.91% | -1.44% | 12.54% |
| 12 Months | 46.40% | 23.60% | 18.45% |
| 5 Years | 269.03% | 72.80% | 113.55% |
MUFG Performance FAQ
Does MUFG outperform the market?
Yes, MUFG significantly outperforms the market. Over the past 12 months, MUFG returned 46.40% compared to 23.60% for the S&P 500.
What is the MUFG return over the last 12 months?
MUFG has returned 46.40% over the past 12 months, including dividends. Over 3 months the return was 7.17%, and over 5 years 269.03%.
How risky is MUFG?
MUFG has relatively low risk with a maximum drawdown of 26.56% over the past 3 years. The average drawdown is 5.02%.
MUFG vs Sectors (12m)
Sorted by outperformance. Positive = MUFG beats sector.
| SECTOR | ETF | DIFFERENCE 12M |
|---|---|---|
| Consumer Staples | XLP | 43.8% |
| Health Care | XLV | 42% |
| Financials | XLF | 40.9% |
| Real Estate | XLRE | 40.9% |
| Consumer Discretionary | XLY | 32.3% |
| Consumer Discretionary | XLY | 32.3% |
| Communication Services | XLC | 24.2% |
| Materials | XLB | 22.7% |
| Industrials | XLI | 14.5% |
| Technology | XLK | 6.3% |
| Energy | XLE | 5.4% |
MUFG vs Asset Classes (12m)
| ASSET CLASS | ETF | DIFFERENCE 12M |
|---|---|---|
| S&P 500 | SPY | 18.45% |
| Gold | GLD | -3.5% |
| Long-Term Bonds | TLT | 47.6% |