RDY Performance: 1.2% Return (12 Months)
RDY returned 1.2% over 12 months, underperforming the S&P 500 (23.6%). Volatility: 23.2%.
RS IBD
8.92
Top 68% in Peers
Volatility
23.2%
Top 9% in Peers
Total Return 12m
1.23%
Top 77% in Peers
RS Rating
27.83
Top 68% in Peers
P/E
| P/E Trailing | 18.7 |
| P/E Forward | 24.8 |
High / Low 52w
| 52 Week High | 16.07 USD |
| 52 Week Low | 12.28 USD |
Sentiment
| VRO Trend Strength ±100 | 30.83 |
| Buy Signal ±3 | -0.30 |
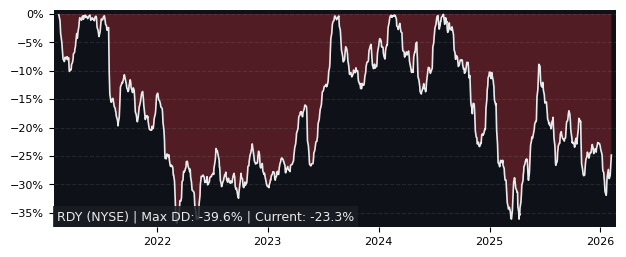
Drawdowns 3y
| Max Drawdown | 26.61% |
| Mean Drawdown | 9.92% |
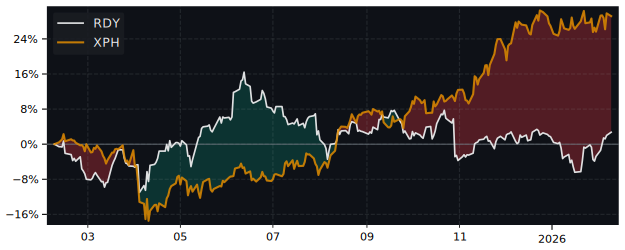
Compare performance with 79 peers in Pharmaceuticals
12m Total Return: RDY (1.2%) vs SPY (23.6%)
5y Drawdown (Underwater) Chart
Top Performer in Pharmaceuticals (5/79)
Short Term Performance
| SYMBOL | 1W | 1M | 3M |
|---|---|---|---|
| ELVN | 0.00% | 35.06% | 155.29% |
| IRD | 4.60% | 7.06% | 113.62% |
| AVIR | 12.50% | 19.50% | 68.91% |
| RLMD | 8.71% | 49.68% | 65.25% |
| ETON | 7.53% | 43.21% | 49.37% |
| RDY | -1.19% | -6.53% | -3.62% |
Long Term Performance
| SYMBOL | 6M | 12M | 5Y |
|---|---|---|---|
| RLMD | 201.29% | 2433.53% | -81.86% |
| TERN | 540.58% | 2162.66% | 153.10% |
| ANRO | 214.66% | 1071.89% | 35.50% |
| NKTR | 27.15% | 754.73% | -74.44% |
| BIOA | 211.94% | 414.71% | -4.42% |
| RDY | -5.93% | 1.23% | 23.71% |
Overall Best Picks of Peer Group (GARP Metrics)
| SYMBOL | MCAP | 1M | 12M | 5Y | P/E | P/E fwd | PEG | EPS stab | EPS cagr |
|---|---|---|---|---|---|---|---|---|---|
| NVS NYSE Novartis |
300B | -3.33% | 41.4% | 113% | 21.7 | 17.2 | 2.69 | 89.2% | 9.19% |
| MRK NYSE Merck |
299B | 1.61% | 45.0% | 92.6% | 16.6 | 23.5 | 3.68 | 20.7% | -1.27% |
| GSK NYSE GlaxoSmithKline |
113B | -0.67% | 51.1% | 93.9% | 15.2 | 22.2 | 0.50 | -17.9% | -45.1% |
| IPN PA Ipsen |
16.0B | 4.17% | 57.5% | 136% | 31.5 | 17.5 | 1.22 | -15.1% | -46.2% |
| RPRX NASDAQ Royalty Pharma |
28.0B | 2.30% | 56.4% | 27.9% | 27.2 | 29.4 | 2.75 | -23.5% | -44.0% |
| JNJ NYSE Johnson & Johnson |
588B | -1.50% | 56.3% | 71.3% | 22.1 | 21.1 | 1.71 | 12.4% | -2.16% |
| AZN NASDAQ AstraZeneca |
311B | 0.86% | 40.1% | 128% | 30.7 | 19.3 | 1.65 | 71.9% | 104% |
Performance: RDY vs S&P 500
Total Return vs S&P 500
| PERIOD | RDY | S&P 500 | DIFFERENCE |
|---|---|---|---|
| 1 Month | -6.53% | -3.34% | -3.30% |
| 3 Months | -3.62% | -4.38% | 0.79% |
| 6 Months | -5.93% | -1.44% | -4.56% |
| 12 Months | 1.23% | 23.60% | -18.1% |
| 5 Years | 23.71% | 72.80% | -28.4% |
FAQs
Does RDY outperform the market?
No, RDY underperforms the market.
Over the past 12 months, RDY returned 1.23% compared to 23.60% for the S&P 500.
What is the RDY return over the last 12 months?
RDY has returned 1.23% over the past 12 months, including dividends.
Over 3 months the return was -3.62%, and over 5 years 23.71%.
How risky is RDY?
RDY has relatively low risk with a maximum drawdown of 26.61% over the past 3 years.
The average drawdown is 9.92%.
RDY vs Sectors (12m)
Sorted by outperformance. Positive = RDY beats sector.
| Sector | ETF | Difference |
|---|---|---|
| Consumer Staples | XLP | -1.37% |
| Health Care | XLV | -3.17% |
| Financials | XLF | -4.23% |
| Real Estate | XLRE | -4.25% |
| Consumer Discretionary | XLY | -12.9% |
| Consumer Discretionary | XLY | -12.9% |
| Communication Services | XLC | -21.0% |
| Materials | XLB | -22.5% |
| Industrials | XLI | -30.7% |
| Technology | XLK | -38.9% |
| Energy | XLE | -39.8% |
RDY vs Asset Classes (12m)
| Asset Class | ETF | Difference |
|---|---|---|
| S&P 500 | SPY | -18.1% |
| Gold | GLD | -48.7% |
| Long-Term Bonds | TLT | 2.45% |