VOYA Performance: 10.4% Return (12 Months)
VOYA returned 10.4% over 12 months, underperforming the S&P 500 (23.6%). Volatility: 30.6%.
RS IBD
-21.53
Top 63% in Peers
Volatility
30.6%
Top 37% in Peers
Total Return 12m
10.42%
Top 38% in Peers
RS Rating
26.13
Top 63% in Peers
P/E
| P/E Trailing | 10.5 |
| P/E Forward | 6.99 |
High / Low 52w
| 52 Week High | 78.48 USD |
| 52 Week Low | 52.87 USD |
Sentiment
| VRO Trend Strength ±100 | 36.71 |
| Buy Signal ±3 | -0.17 |
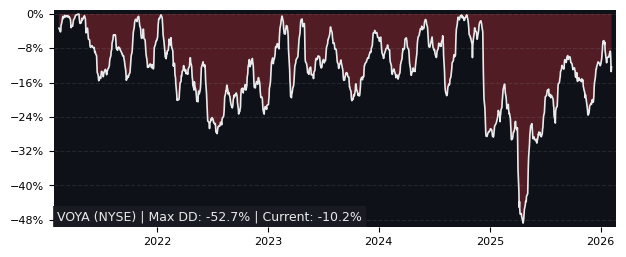
Drawdowns 3y
| Max Drawdown | 34.55% |
| Mean Drawdown | 9.86% |
Compare performance with 12 peers in Diversified Financial Services
12m Total Return: VOYA (10.4%) vs SPY (23.6%)
5y Drawdown (Underwater) Chart
Top Performer in Diversified Financial Services (5/12)
Short Term Performance
| SYMBOL | 1W | 1M | 3M |
|---|---|---|---|
| VOYA | 1.48% | -0.64% | -12.49% |
| ALRS | 1.15% | -1.40% | 2.95% |
| BRK-B | 1.89% | -0.83% | -4.25% |
| BMED | 4.91% | 2.78% | -10.90% |
| IX | 2.60% | -7.51% | 0.64% |
| JXN | 2.27% | -5.77% | -4.66% |
Long Term Performance
| SYMBOL | 6M | 12M | 5Y |
|---|---|---|---|
| VOYA | -9.33% | 10.42% | 12.98% |
| IX | 16.40% | 50.07% | 159.42% |
| ALRS | 10.26% | 44.09% | -8.63% |
| BMED | 7.48% | 36.94% | 232.26% |
| JXN | 1.56% | 41.23% | 311.99% |
| NEWT | 2.27% | 8.65% | -38.68% |
Performance: VOYA vs S&P 500
| Total Return | VOYA | S&P 500 | Difference |
|---|---|---|---|
| 1 Month | -0.64% | -3.34% | 2.80% |
| 3 Months | -12.49% | -4.38% | -8.49% |
| 6 Months | -9.33% | -1.44% | -8.0% |
| 12 Months | 10.42% | 23.60% | -10.7% |
| 5 Years | 12.98% | 72.80% | -34.6% |
FAQs
Does VOYA outperform the market?
No, VOYA underperforms the market.
Over the past 12 months, VOYA returned 10.42% compared to 23.60% for the S&P 500.
What is the VOYA return over the last 12 months?
VOYA has returned 10.42% over the past 12 months, including dividends.
Over 3 months the return was -12.49%, and over 5 years 12.98%.
How risky is VOYA?
VOYA has relatively low risk with a maximum drawdown of 34.55% over the past 3 years.
The average drawdown is 9.86%.
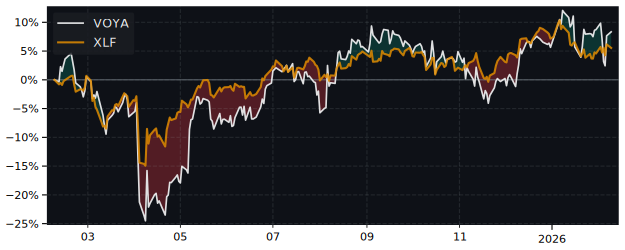
VOYA vs Sectors (12m)
Sorted by outperformance. Positive = VOYA beats sector.
| Sector | ETF | Difference |
|---|---|---|
| Consumer Staples | XLP | 7.82% |
| Health Care | XLV | 6.02% |
| Financials | XLF | 4.96% |
| Real Estate | XLRE | 4.94% |
| Consumer Discretionary | XLY | -3.70% |
| Consumer Discretionary | XLY | -3.70% |
| Communication Services | XLC | -11.8% |
| Materials | XLB | -13.3% |
| Industrials | XLI | -21.5% |
| Technology | XLK | -29.7% |
| Energy | XLE | -30.6% |
VOYA vs Asset Classes (12m)
| Asset Class | ETF | Difference |
|---|---|---|
| S&P 500 | SPY | -10.7% |
| Gold | GLD | -39.5% |
| Long-Term Bonds | TLT | 11.6% |