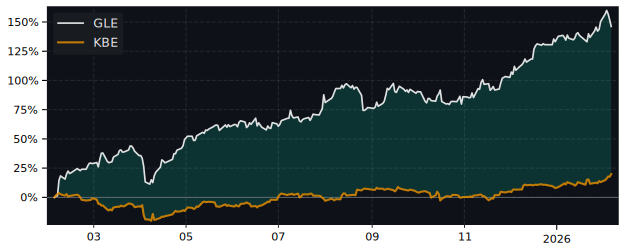
GLE Performance: 95.9% Return (12 Months)
GLE returned 95.9% over 12 months, outperforming the S&P 500 (31.5%). Volatility: 43.9%.
| P/E Trailing | 9.05 |
| P/E Forward | 8.17 |
| 52 Week High | 76.60 EUR |
| 52 Week Low | 33.20 EUR |
| VRO Trend Strength ±100 | 14.38 |
| Buy Signal ±3 | 0.26 |
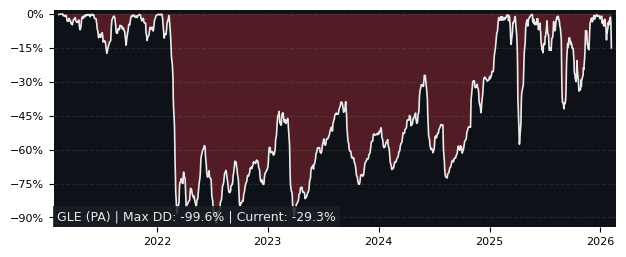
| Max Drawdown | 26.60% |
| Mean Drawdown | 7.23% |
Top Performer in Regional Banks (5/178)
| SYMBOL | 1W | 1M | 3M |
|---|---|---|---|
| FCBC | 0.55% | 4.87% | 28.93% |
| PGC | 3.66% | 6.50% | 27.46% |
| CARE | 0.86% | 12.72% | 18.72% |
| IFS | 4.21% | 11.72% | 17.52% |
| DCOM | 3.45% | 5.36% | 14.76% |
| GLE | 4.42% | -5.50% | -8.65% |
| SYMBOL | 6M | 12M | 5Y |
|---|---|---|---|
| BPE | 16.96% | 111.86% | 666.22% |
| GLE | 19.61% | 95.88% | 257.14% |
| BPSO | 19.12% | 93.40% | 644.49% |
| AMAL | 44.67% | 53.26% | 148.39% |
| BLFY | 48.76% | 50.45% | 2.64% |
| BBAR | 94.06% | 9.32% | 727.01% |
| SYMBOL | MCAP | 1M | 12M | 5Y | P/E | P/E fwd | PEG | EPS stab | EPS cagr |
|---|---|---|---|---|---|---|---|---|---|
| BPOP NASDAQ Popular |
8.91B | 2.55% | 71.4% | 122% | 11.1 | 9.78 | 1.37 | -1.60% | 6.41% |
| HTBK NASDAQ Heritage Commerce |
755M | 3.50% | 60.0% | 33.1% | 15.7 | 11.1 | 1.50 | -37.9% | 7.97% |
| BFC NASDAQ Bank First National |
1.51B | 0.68% | 47.9% | 109% | 18.7 | 5.81 | 0.10 | 65.8% | 11.3% |
| AROW NASDAQ Arrow Financial |
554M | 3.46% | 47.0% | 19.5% | 12.7 | 13.0 | 2.84 | -27.6% | -51.4% |
| NIC NYSE Nicolet Bankshares |
3.18B | -0.99% | 47.6% | 81.9% | 15.2 | - | - | 79.9% | 13.5% |
| AMAL NASDAQ Amalgamated Bank |
1.18B | 2.28% | 53.3% | 148% | 11.6 | - | - | -15.2% | -44.1% |
| HBCP NASDAQ Home Bancorp |
481M | 2.42% | 49.6% | 87.3% | 10.5 | 9.40 | - | 58.6% | 31.0% |
| SPFI NASDAQ South Plains Financial |
681M | 1.82% | 37.0% | 100% | 12.1 | - | - | -28.6% | -49.3% |
| WSFS NASDAQ WSFS Financial |
3.63B | 3.19% | 44.8% | 40.0% | 13.0 | 11.1 | 0.98 | 54.8% | 22.9% |
| FBNC NASDAQ First Bancorp |
2.32B | -2.47% | 57.0% | 41.2% | 20.9 | 14.3 | 1.56 | -15.8% | 3.93% |
Performance: GLE vs S&P 500
| PERIOD | GLE | S&P 500 | DIFFERENCE |
|---|---|---|---|
| 1 Month | -5.50% | -3.48% | -2.10% |
| 3 Months | -8.65% | -4.38% | -4.46% |
| 6 Months | 19.61% | -1.79% | 21.79% |
| 12 Months | 95.88% | 31.52% | 48.93% |
| 5 Years | 257.14% | 72.80% | 106.55% |
GLE Performance FAQ
Does GLE outperform the market?
Yes, GLE significantly outperforms the market. Over the past 12 months, GLE returned 95.88% compared to 31.52% for the S&P 500.
What is the GLE return over the last 12 months?
GLE has returned 95.88% over the past 12 months, including dividends. Over 3 months the return was -8.65%, and over 5 years 257.14%.
How risky is GLE?
GLE has relatively low risk with a maximum drawdown of 26.60% over the past 3 years. The average drawdown is 7.23%.
GLE vs Sectors (12m)
Sorted by outperformance. Positive = GLE beats sector.
| SECTOR | ETF | DIFFERENCE 12M |
|---|---|---|
| Consumer Staples | XLP | 87.4% |
| Health Care | XLV | 84.8% |
| Real Estate | XLRE | 82.6% |
| Financials | XLF | 81.8% |
| Consumer Discretionary | XLY | 75.2% |
| Communication Services | XLC | 66.4% |
| Communication Services | XLC | 66.4% |
| Materials | XLB | 61.7% |
| Industrials | XLI | 54.5% |
| Technology | XLK | 46.8% |
| Energy | XLE | 39.6% |
GLE vs Asset Classes (12m)
| ASSET CLASS | ETF | DIFFERENCE 12M |
|---|---|---|
| S&P 500 | SPY | 48.93% |
| Gold | GLD | 39% |
| Long-Term Bonds | TLT | 95.1% |