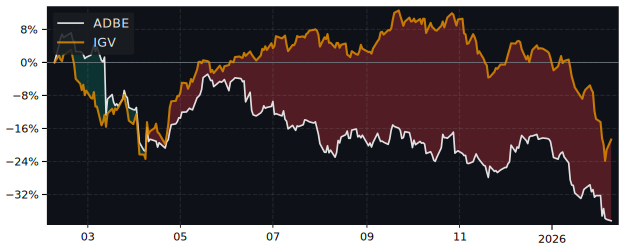
ADBE Performance: -29.5% Return (12 Months)
ADBE returned -29.5% over 12 months, underperforming the S&P 500 (32.2%). Volatility: 34.6%.
| P/E Trailing | 14.2 |
| P/E Forward | 10.3 |
| 52 Week High | 420.68 USD |
| 52 Week Low | 234.84 USD |
| VRO Trend Strength ±100 | 37.55 |
| Buy Signal ±3 | -0.63 |
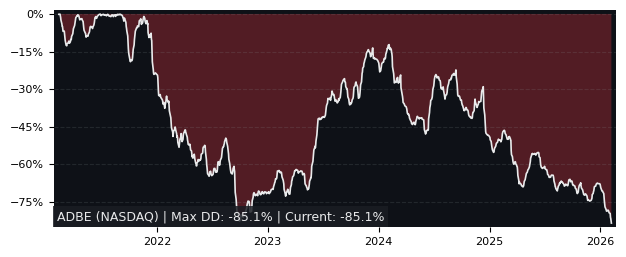
| Max Drawdown | 63.00% |
| Mean Drawdown | 25.06% |
Top Performer in Application Software (5/133)
| SYMBOL | 1W | 1M | 3M |
|---|---|---|---|
| YOU | 8.70% | 14.19% | 47.38% |
| ADEA | 6.16% | 14.49% | 41.41% |
| ZD | 2.45% | 6.83% | 27.11% |
| OVH | 0.00% | 2.64% | 21.44% |
| BTDR | 8.79% | 26.82% | -18.17% |
| ADBE | -1.21% | -14.98% | -28.97% |
| SYMBOL | 6M | 12M | 5Y |
|---|---|---|---|
| APLD | -7.77% | 378.71% | 1578.67% |
| ADEA | 50.22% | 128.20% | 190.28% |
| YOU | 71.45% | 117.58% | 87.61% |
| DBD | 36.49% | 109.34% | 280.41% |
| MITK | 46.57% | 90.52% | -10.54% |
| ADBE | -31.06% | -29.52% | -52.36% |
| SYMBOL | MCAP | 1M | 12M | 5Y | P/E | P/E fwd | PEG | EPS stab | EPS cagr |
|---|---|---|---|---|---|---|---|---|---|
| ADEA NASDAQ ADEIA |
2.78B | 14.5% | 128% | 190% | 25.3 | 17.0 | 1.51 | -17.6% | -54.8% |
| YOU NYSE Clear Secure |
6.92B | 14.2% | 118% | 87.6% | 45.9 | - | - | 47.1% | 50.5% |
| DAVE NASDAQ Dave |
2.29B | -25.2% | 117% | -47.2% | 12.8 | 12.1 | - | 87.8% | 116% |
| FTK XETRA flatexDEGIRO |
3.71B | -6.69% | 61.3% | 36.6% | 24.8 | - | - | 22.2% | 15.5% |
| ZM NASDAQ Zoom Video Communications |
24.4B | 9.03% | 23.5% | -74.0% | 13.3 | 13.9 | 4.21 | 77.4% | 22.7% |
| APP NASDAQ Applovin |
131B | -20.7% | 76.8% | 530% | 38.4 | 24.7 | 1.07 | 64.8% | 15.9% |
| CDNS NASDAQ Cadence Design Systems |
77.0B | -6.23% | 19.5% | 92.3% | 68.5 | 34.4 | 2.49 | 8.80% | -45.0% |
| CGNT NASDAQ Cognyte Software |
614M | -0.90% | 1.15% | -65.6% | - | 17.0 | - | 61.2% | 252% |
| CLBT NASDAQ Cellebrite DI |
3.49B | -5.22% | -21.1% | 41.6% | 45.2 | 35.7 | - | 57.8% | 74.1% |
| PEGA NASDAQ Pegasystems |
7.23B | -8.25% | 34.4% | -30.7% | 20.0 | 15.4 | 14.8 | 42.1% | 6.99% |
Performance: ADBE vs S&P 500
| PERIOD | ADBE | S&P 500 | DIFFERENCE |
|---|---|---|---|
| 1 Month | -14.98% | -2.54% | -12.76% |
| 3 Months | -28.97% | -4.14% | -25.90% |
| 6 Months | -31.06% | -0.92% | -30.42% |
| 12 Months | -29.52% | 32.20% | -46.68% |
| 5 Years | -52.36% | 71.53% | -72.22% |
ADBE Performance FAQ
Does ADBE outperform the market?
No, ADBE underperforms the market. Over the past 12 months, ADBE returned -29.52% compared to 32.20% for the S&P 500.
What is the ADBE return over the last 12 months?
ADBE has returned -29.52% over the past 12 months, including dividends. Over 3 months the return was -28.97%, and over 5 years -52.36%.
How risky is ADBE?
ADBE has relatively low risk with a maximum drawdown of 63.00% over the past 3 years. The average drawdown is 25.06%.
ADBE vs Sectors (12m)
Sorted by outperformance. Positive = ADBE beats sector.
| SECTOR | ETF | DIFFERENCE 12M |
|---|---|---|
| Consumer Staples | XLP | -37.2% |
| Health Care | XLV | -40.5% |
| Real Estate | XLRE | -43.1% |
| Financials | XLF | -44.4% |
| Consumer Discretionary | XLY | -49.8% |
| Communication Services | XLC | -59.1% |
| Communication Services | XLC | -59.1% |
| Materials | XLB | -62.8% |
| Industrials | XLI | -71.4% |
| Technology | XLK | -80.2% |
| Energy | XLE | -88.2% |
ADBE vs Asset Classes (12m)
| ASSET CLASS | ETF | DIFFERENCE 12M |
|---|---|---|
| S&P 500 | SPY | -46.68% |
| Gold | GLD | -87.3% |
| Long-Term Bonds | TLT | -30.1% |