(JNVR) Janover Common Stock - Performance 2444.9% in 12m
JNVR performance: live returns, drawdowns, peer ranking & SPY comparison from 1w to 5y, all in one clean chart-driven dashboard.
Performance Rating
32.98%
#27 in Peer-Group
Rel. Strength
99.93%
#6 in Stock-Universe
Total Return 12m
2444.88%
#3 in Peer-Group
Total Return 5y
468.29%
#7 in Peer-Group
| P/E | Value |
|---|---|
| P/E Trailing | - |
| P/E Forward | - |
| High / Low | USD |
|---|---|
| 52 Week High | 42.50 USD |
| 52 Week Low | 0.49 USD |
| Sentiment | Value |
|---|---|
| VRO Trend Strength +-100 | 65.09 |
| Buy/Sell Signal +-5 | 0.15 |
| Support / Resistance | Levels |
|---|---|
| Support | |
| Resistance |
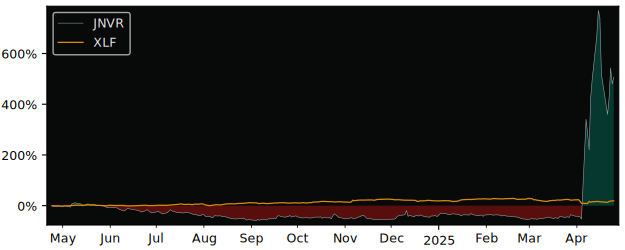
12m Total Return: JNVR (2444.9%) vs QQQ (12.8%)
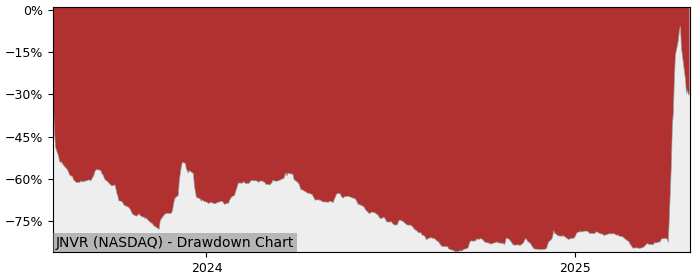
5y Drawdown (Underwater) Chart
Top Performer in Consumer Finance
Overall best picks of Peer Group - Selected by proven GARP Predictive Metrics, sorted by Growth Rating
| Symbol | 1m | 12m | 5y | P/E | P/E Forward | PEG | EPS Stability | EPS CAGR |
|---|---|---|---|---|---|---|---|---|
| SLM NASDAQ SLM |
-5.22% | 53.9% | 401% | 11 | 10.1 | 0.58 | 34.3% | 34% |
| MFIN NASDAQ Medallion Financial |
1.63% | 34.1% | 367% | 6.03 | - | 0.41 | -27.7% | 5.09% |
| EZPW NASDAQ EZCORP |
-1.64% | 28.3% | 111% | 11.1 | 9.72 | 0.35 | 66.9% | 69.2% |
| OMF NYSE OneMain Holdings |
7.65% | 18.2% | 276% | 11.3 | 9.11 | 0.61 | -64.8% | -9.04% |
| COF NYSE Capital One Financial |
8.95% | 48.5% | 228% | 16.3 | 12.9 | 1.46 | -66.5% | -17.3% |
| SYF NYSE Synchrony Financial |
11.5% | 39.7% | 180% | 8.26 | 8.47 | 1.61 | 10.5% | -2.68% |
| CPSS NASDAQ Consumer Portfolio |
13.2% | 10.8% | 255% | 12.2 | 8.24 | 0.33 | -79.3% | -16.5% |
| YRD NYSE Yirendai |
-5.45% | 24.5% | 31.1% | 2.74 | 3.07 | 1.24 | 62.5% | 37.1% |
Performance Comparison: JNVR vs QQQ vs S&P 500
QQQ (Invesco QQQ Trust ETF) is the Sector Benchmark for JNVR
| Total Return (including Dividends) | JNVR | QQQ | S&P 500 |
|---|---|---|---|
| 1 Month | -27.56% | 4.52% | 3.94% |
| 3 Months | 3675.68% | 8.48% | 4.85% |
| 12 Months | 2444.88% | 12.80% | 11.96% |
| 5 Years | 468.29% | 122.85% | 109.71% |
| Trend Score (consistency of price movement) | JNVR | QQQ | S&P 500 |
|---|---|---|---|
| 1 Month | 14.3% | 74.5% | 78.2% |
| 3 Months | 92.3% | 85.5% | 81.9% |
| 12 Months | 41.1% | 39.9% | 43.1% |
| 5 Years | -27.1% | 76.6% | 84% |
| Relative Strength (compared with Indexes) | Rank in Peer Group | vs. QQQ | vs. S&P 500 |
|---|---|---|---|
| 1 Month | #60 | -30.69% | -30.31% |
| 3 Month | #3 | 3380.67% | 3500.97% |
| 12 Month | #1 | 2156.00% | 2173.09% |
| 5 Years | #3 | 299.86% | 320.08% |
FAQs
Does Janover Common Stock (JNVR) outperform the market?
Yes,
over the last 12 months JNVR made 2444.88%, while its related Sector, the Invesco QQQ Trust (QQQ) made 12.80%.
Over the last 3 months JNVR made 3675.68%, while QQQ made 8.48%.
Performance Comparison JNVR vs Indeces and Sectors
Above 0 means better perfomance compared to Symbol in this Timeframe
JNVR vs. Indices
| Symbol | 1w | 1m | 6m | 12m | |
|---|---|---|---|---|---|
| US S&P 500 | SPY | -20% | -31.5% | 3528.3% | 2433% |
| US NASDAQ 100 | QQQ | -19.7% | -32.1% | 3527.9% | 2432% |
| German DAX 40 | DAX | -18.4% | -26% | 3513.1% | 2419% |
| Shanghai Shenzhen CSI 300 | CSI 300 | -20% | -27.1% | 3529.1% | 2431% |
| Hongkong Hang Seng | HSI | -18.9% | -33% | 3511.4% | 2416% |
| India NIFTY 50 | INDA | -19.7% | -27.1% | 3527.9% | 2446% |
| Brasil Bovespa | EWZ | -17.8% | -29.5% | 3505.3% | 2440% |
JNVR vs. Sectors
| Symbol | 1w | 1m | 6m | 12m | |
|---|---|---|---|---|---|
| Communication Services | XLC | -19.7% | -31.3% | 3523.8% | 2422% |
| Consumer Discretionary | XLY | -20.3% | -29.3% | 3536% | 2426% |
| Consumer Staples | XLP | -20.3% | -27.3% | 3526.2% | 2438% |
| Energy | XLE | -18.9% | -33.3% | 3525.7% | 2448% |
| Financial | XLF | -20.7% | -29.1% | 3524.5% | 2421% |
| Health Care | XLV | -17.5% | -29% | 3534.2% | 2454% |
| Industrial | XLI | -20.3% | -29.7% | 3521.5% | 2427% |
| Materials | XLB | -19.3% | -29.5% | 3526.6% | 2446% |
| Real Estate | XLRE | -21.3% | -32% | 3524.5% | 2432% |
| Technology | XLK | -20.1% | -34.7% | 3527.7% | 2435% |
| Utilities | XLU | -20.4% | -27.8% | 3522.3% | 2426% |
| Aerospace & Defense | XAR | -22.3% | -35.6% | 3508.4% | 2402% |
| Biotech | XBI | -18.8% | -31.7% | 3540.3% | 2457% |
| Homebuilder | XHB | -22.3% | -30.4% | 3537.5% | 2451% |
| Retail | XRT | -20.3% | -30.9% | 3533.3% | 2442% |
JNVR vs. Commodities
| Symbol | 1w | 1m | 6m | 12m | |
|---|---|---|---|---|---|
| Oil | USO | -17.4% | -39.9% | 3,525% | 2449% |
| Natural Gas | UNG | -19.3% | -27.6% | 3522.1% | 2459% |
| Gold | GLD | -19.9% | -28% | 3500.8% | 2401% |
| Silver | SLV | -19.9% | -35.8% | 3507.7% | 2423% |
| Copper | CPER | -21.6% | -28.4% | 3510.1% | 2433% |
JNVR vs. Bonds
| Symbol | 1w | 1m | 6m | 12m | |
|---|---|---|---|---|---|
| iShares 20+ Years Bond | TLT | -21.7% | -30.6% | 3528.9% | 2449% |
| iShares High Yield Corp. Bond | HYG | -20.7% | -29.3% | 3525.4% | 2435% |