(C051) Amundi Euro Stoxx - Performance 21.8% in 12m
Compare C051 with Indices, Sectors and Commodities and Bonds. Who performs better in which timeframe?
Performance Rating
62.73%
#62 in Group
Rel. Strength
76.47%
#1879 in Universe
Total Return 12m
21.78%
#3 in Group
Total Return 5y
87.35%
#57 in Group
P/E -
(?) Percentile in Group
P/E Forward -
(?) Percentile in Group
PEG -
(?) Percentile in Group
FCF Yield -
(?) Percentile in Group
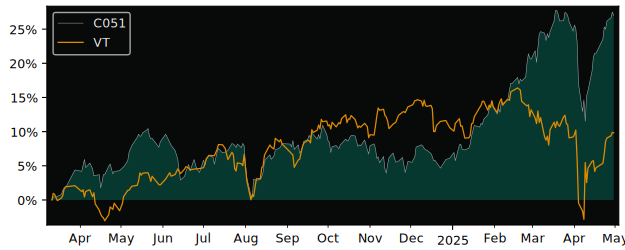
12m Total Return: C051 (21.8%) vs VT (11.6%)
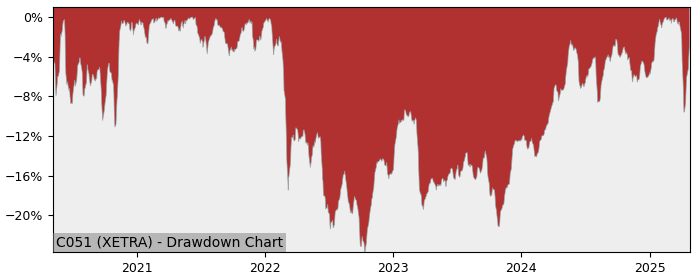
5y Drawdown (Underwater) Chart
Top Performers in Eurozone Large-Cap Equity
Overall best picks of Peer Group Selected by proven GARP Predictive Metrics, sorted by Growth Rating
| Symbol | 1m | 12m | 5y | P/E | P/E Forward | PEG | EPS Stability |
EPS CAGR |
|---|---|---|---|---|---|---|---|---|
| ELFB XETRA Deka Oekom Euro |
1.17% | 18.4% | 163% | - | - | - | - | - |
| H4ZA XETRA HSBC EURO STOXX 50 |
-1.36% | 10.1% | 116% | - | - | - | - | - |
| UET5 XETRA UBS(Lux)Fund Solutions – |
0.19% | 10.3% | 126% | - | - | - | - | - |
| ETDD XETRA BNP Paribas Easy Euro Stoxx |
-1.57% | 7.14% | 110% | - | - | - | - | - |
| CSSX5E SW iShares VII - iShares Core |
-1.05% | 7.71% | 111% | - | - | - | - | - |
| EUN2 XETRA iShares II Public |
-1.14% | 7.64% | 111% | - | - | - | - | - |
| SXRT XETRA iShares VII - iShares Core |
-1.12% | 7.62% | 111% | - | - | - | - | - |
| C50 PA Amundi Index Solutions |
-1.19% | 7.54% | 110% | - | - | - | - | - |
Performance Comparison: C051 vs VT vs S&P 500
VT (Vanguard Total World Stock ETF) is the Sector Benchmark for C051
| Total Return (including Dividends) | C051 | VT | S&P 500 |
|---|---|---|---|
| 1 Month | 1.84% | 0.56% | -0.87% |
| 3 Months | 11.87% | -3.38% | -7.58% |
| 12 Months | 21.78% | 11.58% | 11.88% |
| 5 Years | 87.35% | 90.66% | 110.33% |
| Trend Score (consistency of price movement) | C051 | VT | S&P 500 |
| 1 Month | 49.5% | 34.2% | 23% |
| 3 Months | 54.4% | -84.7% | -88.5% |
| 12 Months | 70.7% | 59.4% | 55.1% |
| 5 Years | 53.1% | 72.5% | 84.1% |
| Relative Strength (compared with Indexes) | Rank in Peer Group | vs. VT | vs. S&P 500 |
| 1 Month | #9 | 1.27% | 2.73% |
| 3 Month | #1 | 15.8% | 21.1% |
| 12 Month | #3 | 9.14% | 8.85% |
| 5 Years | #66 | -1.74% | -10.9% |
FAQs
Does C051 Amundi Euro Stoxx outperforms the market?
Yes,
over the last 12 months C051 made 21.78%, while its related Sector, the Vanguard Total World Stock (VT) made 11.58%.
Over the last 3 months C051 made 11.87%, while VT made -3.38%.
Over the last 3 months C051 made 11.87%, while VT made -3.38%.
Performance Comparison C051 vs Indeces and Sectors
C051 vs. Indices C051 is Over or Underperforming
| Symbol | 1w | 1m | 6m | 12m | |
|---|---|---|---|---|---|
| US S&P 500 | SPY | -2.23% | 2.71% | 20.9% | 9.90% |
| US NASDAQ 100 | QQQ | -3.26% | 0.44% | 20.4% | 9.11% |
| US Dow Jones Industrial 30 | DIA | -1.29% | 5.02% | 20.9% | 12.6% |
| German DAX 40 | DAX | -1.00% | 0.52% | 1.33% | -2.90% |
| Shanghai Shenzhen CSI 300 | CSI 300 | 1.73% | 4.66% | 23.8% | 15.8% |
| Hongkong Hang Seng | HSI | -1.24% | 1.78% | 18.9% | 7.89% |
| India NIFTY 50 | INDA | 0.61% | -2.22% | 20.6% | 18.7% |
| Brasil Bovespa | EWZ | -1.43% | -2.76% | 17.2% | 27.6% |
C051 vs. Sectors C051 is Over or Underperforming
| Symbol | 1w | 1m | 6m | 12m | |
|---|---|---|---|---|---|
| Communication Services | XLC | -2.48% | 2.89% | 14.7% | -2.18% |
| Consumer Discretionary | XLY | -2.31% | 1.94% | 18.3% | 8.46% |
| Consumer Staples | XLP | 1.27% | 1.64% | 15.5% | 10.6% |
| Energy | XLE | 2.25% | 15.7% | 26.6% | 32.9% |
| Financial | XLF | -0.84% | 3.95% | 13.3% | -0.91% |
| Health Care | XLV | -2.15% | 5.63% | 22.5% | 20.1% |
| Industrial | XLI | -2.65% | 1.73% | 20.1% | 12.2% |
| Materials | XLB | -1.62% | 4.27% | 28.3% | 25.3% |
| Real Estate | XLRE | -0.71% | 3.15% | 21.7% | 3.69% |
| Technology | XLK | -4.68% | 0.15% | 24.2% | 14.1% |
| Utilities | XLU | 0.61% | 1.78% | 18.7% | -0.05% |
| Aerospace & Defense | XAR | -3.18% | -4.55% | 7.32% | -4.79% |
| Biotech | XBI | -3.53% | -0.44% | 33.5% | 23.6% |
| Homebuilder | XHB | -1.54% | 4.11% | 35.7% | 28.8% |
| Retail | XRT | -0.66% | 2.40% | 26.4% | 24.5% |