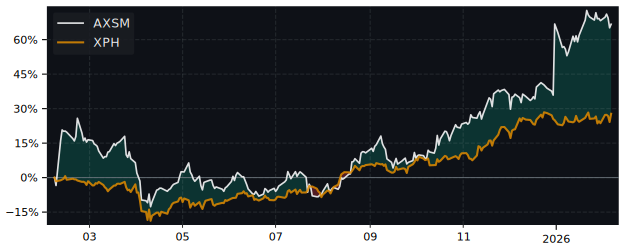
AXSM Performance: 77.5% Return (12 Months)
AXSM returned 77.5% over 12 months, outperforming the S&P 500 (37.7%). Volatility: 41.0%.
| P/E Trailing | 0.00 |
| P/E Forward | 333 |
| 52 Week High | 189.10 USD |
| 52 Week Low | 95.65 USD |
| VRO Trend Strength ±100 | 68.64 |
| Buy Signal ±3 | 0.85 |
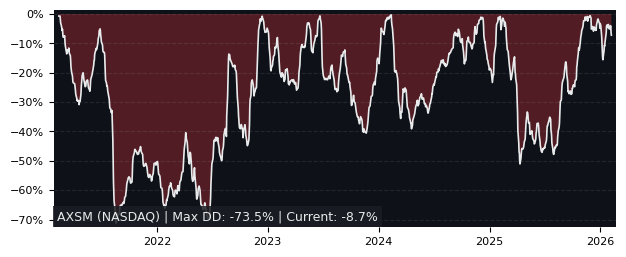
| Max Drawdown | 36.45% |
| Mean Drawdown | 13.57% |
Top Performer in Pharmaceuticals (5/81)
| SYMBOL | 1W | 1M | 3M |
|---|---|---|---|
| IRD | 9.81% | 7.97% | 157.50% |
| ELVN | 13.60% | 44.40% | 84.65% |
| NKTR | -0.83% | 8.58% | 81.18% |
| ETON | 4.08% | 58.05% | 59.78% |
| PAHC | 7.12% | 20.25% | 48.02% |
| AXSM | 0.82% | 5.29% | 3.37% |
| SYMBOL | 6M | 12M | 5Y |
|---|---|---|---|
| RLMD | 229.11% | 2683.96% | -80.35% |
| TERN | 537.53% | 2468.78% | 196.84% |
| ANRO | 249.60% | 969.46% | 35.69% |
| NKTR | 32.74% | 916.72% | -73.20% |
| BIOA | 218.17% | 493.42% | -1.47% |
| AXSM | 45.89% | 77.54% | 233.76% |
| SYMBOL | MCAP | 1M | 12M | 5Y | P/E | P/E fwd | PEG | EPS stab | EPS cagr |
|---|---|---|---|---|---|---|---|---|---|
| MRK NYSE Merck |
299B | 5.96% | 61.7% | 98.2% | 16.6 | 23.5 | 3.68 | 20.7% | -1.27% |
| GSK NYSE GlaxoSmithKline |
113B | 3.35% | 74.8% | 96.4% | 15.5 | 22.4 | 0.50 | -17.9% | -45.1% |
| IPN PA Ipsen |
15.9B | 5.77% | 66.5% | 130% | 31.4 | 17.7 | 1.24 | -15.1% | -46.2% |
| RPRX NASDAQ Royalty Pharma |
28.1B | 4.49% | 59.0% | 30.6% | 27.3 | 29.8 | 2.78 | -23.5% | -44.0% |
| JNJ NYSE Johnson & Johnson |
586B | -0.53% | 65.4% | 71.9% | 22.0 | 21.1 | 1.71 | 12.4% | -2.16% |
| AZN NASDAQ AstraZeneca |
315B | 4.78% | 60.1% | 130% | 31.2 | 19.3 | 1.65 | 71.9% | 104% |
| INVA NASDAQ Innoviva |
1.72B | 5.82% | 36.9% | 102% | 6.98 | 11.9 | 0.34 | 0.60% | -1.26% |
| PHAT NASDAQ Phathom Pharmaceuticals |
894M | 6.30% | 178% | -68.9% | - | - | - | 67.6% | 53.3% |
Performance: AXSM vs S&P 500
| PERIOD | AXSM | S&P 500 |
|---|---|---|
| 1 Week | 0.82% | 3.17% |
| 1 Month | 5.29% | -0.06% |
| 3 Months | 3.37% | -1.69% |
| 6 Months | 45.89% | 1.00% |
| 12 Months | 77.54% | 37.72% |
| 5 Years | 233.76% | 75.84% |
AXSM Performance FAQ
Does AXSM outperform the market?
Yes, AXSM significantly outperforms the market. Over the past 12 months, AXSM returned 77.54% compared to 37.72% for the S&P 500.
What is the AXSM return over the last 12 months?
AXSM has returned 77.54% over the past 12 months, including dividends. Over 3 months the return was 3.37%, and over 5 years 233.76%.
How risky is AXSM?
AXSM has relatively low risk with a maximum drawdown of 36.45% over the past 3 years. The average drawdown is 13.57%.
AXSM vs Sectors (12m)
Sorted by outperformance. Positive = AXSM beats sector.
| SECTOR | ETF | DIFFERENCE 12M |
|---|---|---|
| Consumer Staples | XLP | 66.1% |
| Health Care | XLV | 63% |
| Financials | XLF | 59.2% |
| Real Estate | XLRE | 59.1% |
| Consumer Discretionary | XLY | 50.9% |
| Consumer Discretionary | XLY | 50.9% |
| Communication Services | XLC | 43.8% |
| Materials | XLB | 35.5% |
| Industrials | XLI | 29.2% |
| Energy | XLE | 20.8% |
| Technology | XLK | 19% |
AXSM vs Asset Classes (12m)
| ASSET CLASS | ETF | DIFFERENCE 12M |
|---|---|---|
| S&P 500 | SPY | 39.8% |
| Emerging Market | EEM | 16.9% |
| Gold | GLD | 19.6% |
| Long-Term Bonds | TLT | 74.7% |
| Risk-Free Cash | SHY | 74% |