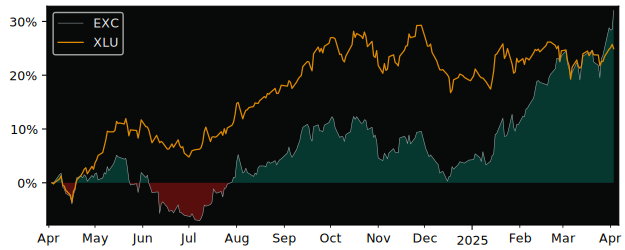
EXC Performance: 8.2% Return (12 Months)
EXC returned 8.2% over 12 months, underperforming the S&P 500 (23.6%). Volatility: 18.9%.
RS (IBD)
34.66
Top 62% in Peers
Volatility
18.9%
Top 34% in Peers
Total Return 12m
8.16%
Top 86% in Peers
RS Rating
66.05
Top 62% in Peers
| P/E | Value |
|---|---|
| P/E Trailing | 18.0 |
| P/E Forward | 15.9 |
| High / Low | USD |
|---|---|
| 52 Week High | 50.29 USD |
| 52 Week Low | 41.11 USD |
| Sentiment | Value |
|---|---|
| VRO Trend Strength +-100 | 69.98 |
| Buy Signal +-3 | 0.08 |
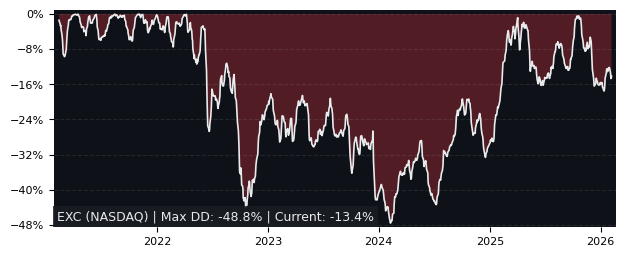
| Drawdowns | in 3y |
|---|---|
| Max Drawdown | 20.82% |
| Mean Drawdown | 6.98% |
Peer Group: Electric Utilities (45 symbols)
12m Total Return: EXC (8.2%) vs SPY (23.6%)
5y Drawdown (Underwater) Chart
Top Performer in Electric Utilities (5/45)
Short Term Performance
| Symbol | 1w | 1m | 3m |
|---|---|---|---|
| EXC | 2.09% | 0.76% | 14.27% |
| ELPC | 8.50% | 14.31% | 37.40% |
| ELE | 7.56% | 15.08% | 21.78% |
| CIG | 6.73% | 15.05% | 20.58% |
| RWE | 7.94% | 10.90% | 24.89% |
| ETR | 4.57% | 8.59% | 24.97% |
Long Term Performance
| Symbol | 6m | 12m | 5y |
|---|---|---|---|
| EXC | 10.69% | 8.16% | 85.40% |
| ELPC | 51.54% | 98.97% | 83.53% |
| RWE | 50.28% | 78.64% | 99.18% |
| ENGI | 54.80% | 66.27% | 252.23% |
| EDN | 96.91% | 2.83% | 756.02% |
| ANA | 31.97% | 91.32% | 92.83% |
Overall best picks of Peer Group (GARP Metrics)
| Symbol | Market Cap | 1m | 12m | 5y | P/E | P/E Forward | PEG | EPS Stability | EPS CAGR |
|---|---|---|---|---|---|---|---|---|---|
| ELE MC Endesa |
41.8B | 15.1% | 53.1% | 118% | 16.6 | 16.8 | 3.99 | 2.10% | 11.4% |
| CIG NYSE Companhia Energetica de |
7.38B | 15.1% | 62.1% | 318% | 7.06 | 10.2 | 0.33 | 11.3% | -4.46% |
| ANA MC Acciona |
14.5B | 6.53% | 91.3% | 92.8% | 15.6 | 24.6 | 1.32 | -8.80% | -41.1% |
| EIX NYSE Edison International |
28.3B | -0.54% | 33.7% | 53.7% | 6.36 | 12.1 | 3.48 | 52.1% | 16.1% |
Performance: EXC vs S&P 500
| Total Return | EXC | S&P 500 | Difference |
|---|---|---|---|
| 1 Month | 0.76% | -3.34% | 4.24% |
| 3 Months | 14.27% | -4.38% | 19.5% |
| 6 Months | 10.69% | -1.44% | 12.3% |
| 12 Months | 8.16% | 23.60% | -12.5% |
| 5 Years | 85.40% | 72.80% | 7.29% |
FAQs
Does EXC outperform the market?
No, EXC underperforms the market.
Over the past 12 months, EXC returned 8.16% compared to 23.60% for the S&P 500.
What is the EXC return over the last 12 months?
EXC has returned 8.16% over the past 12 months, including dividends.
Over 3 months the return was 14.27%, and over 5 years 85.40%.
How risky is EXC?
EXC has relatively low risk with a maximum drawdown of 20.82% over the past 3 years.
The average drawdown is 6.98%.
EXC vs Sectors (12m)
Sorted by outperformance. Positive = EXC beats sector.
| Sector | ETF | Difference |
|---|---|---|
| Consumer Staples | XLP | 5.56% |
| Health Care | XLV | 3.76% |
| Financials | XLF | 2.70% |
| Real Estate | XLRE | 2.68% |
| Consumer Discretionary | XLY | -5.96% |
| Consumer Discretionary | XLY | -5.96% |
| Communication Services | XLC | -14.1% |
| Materials | XLB | -15.6% |
| Industrials | XLI | -23.7% |
| Technology | XLK | -32.0% |
| Energy | XLE | -32.8% |
EXC vs Asset Classes (12m)
| Asset Class | ETF | Difference |
|---|---|---|
| S&P 500 | SPY | -12.5% |
| Gold | GLD | -41.8% |
| Long-Term Bonds | TLT | 9.38% |