UPST Performance: -23.9% Return (12 Months)
UPST returned -23.9% over 12 months, underperforming the S&P 500 (37.7%). Volatility: 83.5%.
| P/E Trailing | 58.8 |
| P/E Forward | 26.7 |
| 52 Week High | 84.13 USD |
| 52 Week Low | 24.22 USD |
| VRO Trend Strength ±100 | 51.99 |
| Buy Signal ±3 | -1.19 |
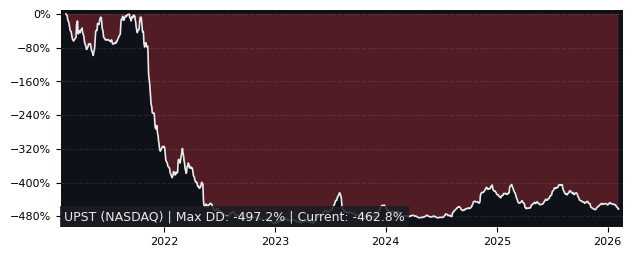
| Max Drawdown | 72.72% |
| Mean Drawdown | 42.40% |
Top Performer in Consumer Finance (5/30)
| SYMBOL | 1W | 1M | 3M |
|---|---|---|---|
| ECPG | 5.52% | 9.66% | 32.78% |
| EZPW | 7.72% | 5.02% | 30.62% |
| FCFS | 4.70% | 1.34% | 20.59% |
| PRAA | 5.91% | 2.84% | 10.05% |
| WRLD | 7.00% | 10.05% | 0.78% |
| UPST | 7.69% | -2.18% | -46.04% |
| SYMBOL | 6M | 12M | 5Y |
|---|---|---|---|
| ECPG | 75.25% | 175.64% | 91.74% |
| BFH | 43.88% | 86.19% | 20.92% |
| EZPW | 47.92% | 83.80% | 423.93% |
| ENVA | 36.24% | 71.04% | 329.55% |
| FCFS | 28.17% | 70.36% | 211.73% |
| UPST | -47.24% | -23.91% | -75.72% |
| SYMBOL | MCAP | 1M | 12M | 5Y | P/E | P/E fwd | PEG | EPS stab | EPS cagr |
|---|---|---|---|---|---|---|---|---|---|
| ECPG NASDAQ Encore Capital |
1.65B | 9.66% | 176% | 91.7% | 6.76 | 4.04 | 0.17 | 18.5% | -10.6% |
| JCAP NASDAQ Jefferson Capital, Common |
1.08B | -5.50% | 9.70% | 9.70% | 3.45 | - | - | -96.5% | -36.5% |
| LC NYSE LendingClub |
1.65B | 1.76% | 75.5% | 0.40% | 12.3 | 7.96 | -18.1 | -13.8% | -61.4% |
Performance: UPST vs S&P 500
| PERIOD | UPST | S&P 500 |
|---|---|---|
| 1 Week | 7.69% | 3.17% |
| 1 Month | -2.18% | -0.06% |
| 3 Months | -46.04% | -1.69% |
| 6 Months | -47.24% | 1.00% |
| 12 Months | -23.91% | 37.72% |
| 5 Years | -75.72% | 75.84% |
UPST Performance FAQ
Does UPST outperform the market?
No, UPST underperforms the market. Over the past 12 months, UPST returned -23.91% compared to 37.72% for the S&P 500.
What is the UPST return over the last 12 months?
UPST has returned -23.91% over the past 12 months, including dividends. Over 3 months the return was -46.04%, and over 5 years -75.72%.
How risky is UPST?
UPST has relatively low risk with a maximum drawdown of 72.72% over the past 3 years. The average drawdown is 42.40%.
UPST vs Sectors (12m)
Sorted by outperformance. Positive = UPST beats sector.
| SECTOR | ETF | DIFFERENCE 12M |
|---|---|---|
| Consumer Staples | XLP | -35.3% |
| Health Care | XLV | -38.5% |
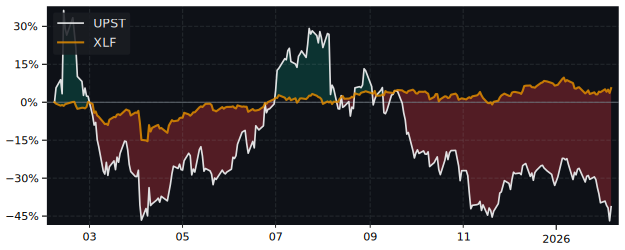
| Financials | XLF | -42.3% |
| Real Estate | XLRE | -42.4% |
| Consumer Discretionary | XLY | -50.6% |
| Consumer Discretionary | XLY | -50.6% |
| Communication Services | XLC | -57.7% |
| Materials | XLB | -66% |
| Industrials | XLI | -72.3% |
| Energy | XLE | -80.7% |
| Technology | XLK | -82.5% |
UPST vs Asset Classes (12m)
| ASSET CLASS | ETF | DIFFERENCE 12M |
|---|---|---|
| S&P 500 | SPY | -61.6% |
| Emerging Market | EEM | -84.6% |
| Gold | GLD | -81.8% |
| Long-Term Bonds | TLT | -26.8% |
| Risk-Free Cash | SHY | -27.4% |