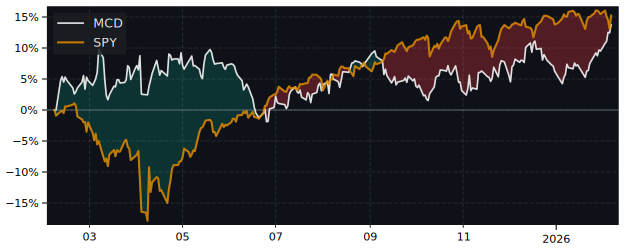
MCD Performance: 4.8% Return (12 Months)
MCD returned 4.8% over 12 months, underperforming the S&P 500 (37.7%). Volatility: 17.8%.
| P/E Trailing | 25.7 |
| P/E Forward | 23.2 |
| 52 Week High | 339.17 USD |
| 52 Week Low | 280.69 USD |
| VRO Trend Strength ±100 | 14.85 |
| Buy Signal ±3 | 0.42 |
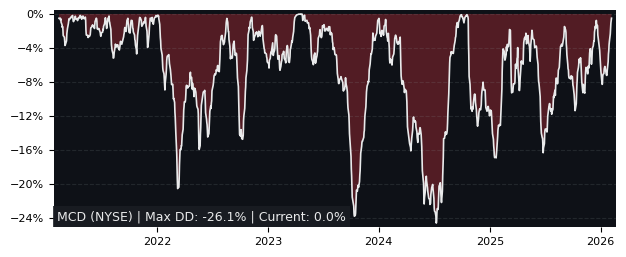
| Max Drawdown | 17.21% |
| Mean Drawdown | 5.16% |
Top Performer in Restaurants (5/38)
| SYMBOL | 1W | 1M | 3M |
|---|---|---|---|
| LOCO | 0.94% | 26.79% | 27.95% |
| PTLO | 5.56% | 13.77% | 25.27% |
| CAVA | 7.57% | 5.38% | 23.86% |
| QSR | 3.28% | 6.66% | 13.96% |
| ARMK | 3.41% | 7.42% | 11.94% |
| MCD | -0.09% | -7.19% | -0.05% |
| SYMBOL | 6M | 12M | 5Y |
|---|---|---|---|
| BH | -0.78% | 67.45% | 158.20% |
| LOCO | 46.55% | 37.76% | -4.11% |
| BJRI | 22.96% | 28.24% | -35.77% |
| ARCO | 25.11% | 26.46% | 86.58% |
| CAVA | 36.49% | 9.88% | 96.92% |
| MCD | 5.50% | 4.76% | 48.92% |
| SYMBOL | MCAP | 1M | 12M | 5Y | P/E | P/E fwd | PEG | EPS stab | EPS cagr |
|---|---|---|---|---|---|---|---|---|---|
| YUM NYSE Yum! Brands |
43.3B | 0.36% | 15.7% | 51.3% | 28.1 | 23.7 | 1.92 | -11.1% | -44.2% |
| MCD NYSE McDonald’s |
219B | -7.19% | 4.76% | 48.9% | 25.7 | 23.2 | 2.76 | 68.4% | 8.72% |
| EAT NYSE Brinker International |
6.43B | 11.7% | 15.6% | 126% | 14.6 | 11.8 | 0.89 | 43.2% | -23.0% |
| CAKE NASDAQ The Cheesecake Factory |
2.84B | -8.64% | 32.7% | 8.60% | 18.7 | 13.8 | 1.15 | 67.0% | 22.3% |
| DRI NYSE Darden Restaurants |
21.9B | -2.97% | 8.01% | 59.2% | 20.1 | 17.1 | 1.72 | 44.6% | 7.24% |
| BJRI NASDAQ BJs Restaurants |
760M | 5.90% | 28.2% | -35.8% | 16.6 | 16.6 | 1.19 | 38.6% | -1.40% |
Performance: MCD vs S&P 500
| PERIOD | MCD | S&P 500 |
|---|---|---|
| 1 Week | -0.09% | 3.17% |
| 1 Month | -7.19% | -0.06% |
| 3 Months | -0.05% | -1.69% |
| 6 Months | 5.50% | 1.00% |
| 12 Months | 4.76% | 37.72% |
| 5 Years | 48.92% | 75.84% |
MCD Performance FAQ
Does MCD outperform the market?
No, MCD underperforms the market. Over the past 12 months, MCD returned 4.76% compared to 37.72% for the S&P 500.
What is the MCD return over the last 12 months?
MCD has returned 4.76% over the past 12 months, including dividends. Over 3 months the return was -0.05%, and over 5 years 48.92%.
How risky is MCD?
MCD has relatively low risk with a maximum drawdown of 17.21% over the past 3 years. The average drawdown is 5.16%.
MCD vs Sectors (12m)
Sorted by outperformance. Positive = MCD beats sector.
| SECTOR | ETF | DIFFERENCE 12M |
|---|---|---|
| Consumer Staples | XLP | -6.7% |
| Health Care | XLV | -9.8% |
| Financials | XLF | -13.6% |
| Real Estate | XLRE | -13.7% |
| Consumer Discretionary | XLY | -21.9% |
| Consumer Discretionary | XLY | -21.9% |
| Communication Services | XLC | -29% |
| Materials | XLB | -37.3% |
| Industrials | XLI | -43.6% |
| Energy | XLE | -52% |
| Technology | XLK | -53.8% |
MCD vs Asset Classes (12m)
| ASSET CLASS | ETF | DIFFERENCE 12M |
|---|---|---|
| S&P 500 | SPY | -33% |
| Emerging Market | EEM | -55.9% |
| Gold | GLD | -53.1% |
| Long-Term Bonds | TLT | 1.9% |
| Risk-Free Cash | SHY | 1.3% |