MTW Performance: 61.3% Return (12 Months)
MTW returned 61.3% over 12 months, outperforming the S&P 500 (25.4%). Volatility: 52.8%.
| P/E Trailing | 59.0 |
| P/E Forward | 30.9 |
| 52 Week High | 15.15 USD |
| 52 Week Low | 7.24 USD |
| VRO Trend Strength ±100 | 47.55 |
| Buy Signal ±3 | 0.34 |
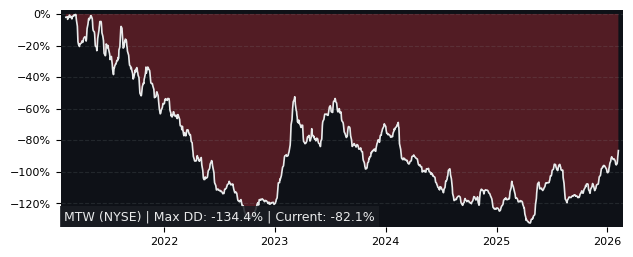
| Max Drawdown | 63.27% |
| Mean Drawdown | 35.67% |
Top Performer in Construction Machinery & Heavy Transportation Equipment (5/27)
| SYMBOL | 1W | 1M | 3M |
|---|---|---|---|
| BLBD | 8.53% | 19.92% | 31.39% |
| PLOW | 11.14% | 7.70% | 30.61% |
| ASTE | 11.12% | 6.94% | 29.12% |
| CAT | 9.74% | 11.67% | 27.73% |
| ALSN | 8.90% | 9.08% | 22.59% |
| MTW | 10.81% | -1.66% | -3.91% |
| SYMBOL | 6M | 12M | 5Y |
|---|---|---|---|
| CYD | 13.51% | 212.68% | 240.51% |
| CAT | 58.12% | 165.12% | 273.78% |
| TES | 20.54% | 151.23% | 19.93% |
| PLOW | 56.25% | 113.59% | 20.06% |
| CMI | 44.29% | 109.86% | 163.50% |
| MTW | 23.06% | 61.34% | -40.63% |
| SYMBOL | MCAP | 1M | 12M | 5Y | P/E | P/E fwd | PEG | EPS stab | EPS cagr |
|---|---|---|---|---|---|---|---|---|---|
| CAT NYSE Caterpillar |
361B | 11.7% | 165% | 274% | 41.0 | 31.8 | 1.96 | 60.1% | 16.8% |
| PLOW NYSE Douglas Dynamics |
982M | 7.70% | 114% | 20.1% | 21.7 | 17.9 | 1.19 | -4.40% | -21.1% |
| CMI NYSE Cummins |
82.5B | 11.1% | 110% | 164% | 29.1 | 21.1 | 1.51 | 31.9% | 1.49% |
| WAB NYSE Westinghouse Air Brake |
43.7B | 9.69% | 54.9% | 245% | 37.4 | 24.1 | 1.37 | 93.1% | 18.0% |
| ALSN NYSE Allison Transmission |
10.4B | 9.08% | 40.0% | 215% | 16.0 | 13.1 | 0.71 | -23.1% | -42.0% |
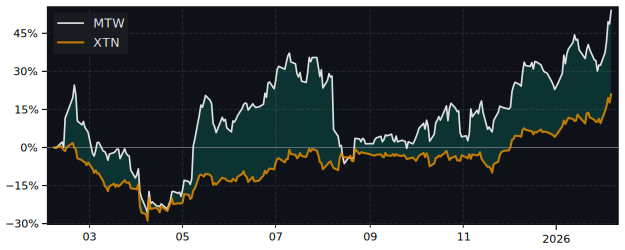
Performance: MTW vs S&P 500
| PERIOD | MTW | S&P 500 |
|---|---|---|
| 1 Week | 10.81% | 3.67% |
| 1 Month | -1.66% | 0.52% |
| 3 Months | -3.91% | -1.77% |
| 6 Months | 23.06% | 1.88% |
| 12 Months | 61.34% | 25.35% |
| 5 Years | -40.63% | 76.85% |
MTW Performance FAQ
Does MTW outperform the market?
Yes, MTW significantly outperforms the market. Over the past 12 months, MTW returned 61.34% compared to 25.35% for the S&P 500.
What is the MTW return over the last 12 months?
MTW has returned 61.34% over the past 12 months, including dividends. Over 3 months the return was -3.91%, and over 5 years -40.63%.
How risky is MTW?
MTW has relatively low risk with a maximum drawdown of 63.27% over the past 3 years. The average drawdown is 35.67%.
MTW vs Sectors (12m)
Sorted by outperformance. Positive = MTW beats sector.
| SECTOR | ETF | DIFFERENCE 12M |
|---|---|---|
| Consumer Staples | XLP | 53.2% |
| Health Care | XLV | 51.8% |
| Financials | XLF | 51% |
| Real Estate | XLRE | 48.6% |
| Consumer Discretionary | XLY | 45.1% |
| Communication Services | XLC | 37.9% |
| Communication Services | XLC | 37.9% |
| Materials | XLB | 30.9% |
| Industrials | XLI | 23.7% |
| Technology | XLK | 21.2% |
| Energy | XLE | 17.7% |
MTW vs Asset Classes (12m)
| ASSET CLASS | ETF | DIFFERENCE 12M |
|---|---|---|
| S&P 500 | SPY | 36% |
| Emerging Market | EEM | 11.5% |
| Gold | GLD | 7.9% |
| Long-Term Bonds | TLT | 59.4% |
| Risk-Free Cash | SHY | 57.8% |