VLO Performance: 135.6% Return (12 Months)
VLO returned 135.6% over 12 months, outperforming the S&P 500 (31.5%). Volatility: 33.6%.
| P/E Trailing | 32.2 |
| P/E Forward | 16.8 |
| 52 Week High | 254.32 USD |
| 52 Week Low | 101.70 USD |
| VRO Trend Strength ±100 | 68.70 |
| Buy Signal ±3 | 1.55 |
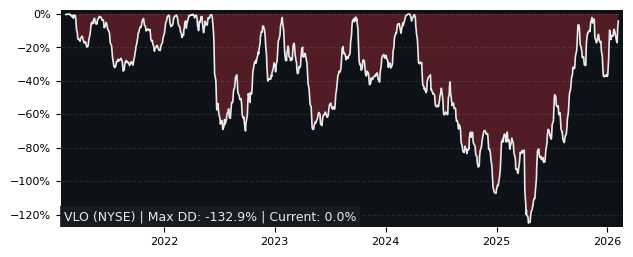
| Max Drawdown | 41.22% |
| Mean Drawdown | 14.56% |
Top Performer in Oil & Gas Refining & Marketing (5/19)
| SYMBOL | 1W | 1M | 3M |
|---|---|---|---|
| AMTX | -2.77% | 127.34% | 96.27% |
| ALTO | 1.74% | 16.17% | 88.31% |
| CLMT | 0.06% | 15.75% | 79.61% |
| PARR | 1.55% | 29.86% | 74.15% |
| GPRE | 2.60% | 9.35% | 71.49% |
| VLO | -2.47% | 7.04% | 36.00% |
| SYMBOL | 6M | 12M | 5Y |
|---|---|---|---|
| ALTO | 309.65% | 436.78% | -18.36% |
| PARR | 84.14% | 370.22% | 338.45% |
| GPRE | 69.09% | 335.99% | -42.63% |
| DK | 42.42% | 278.65% | 132.70% |
| CLMT | 92.32% | 256.66% | 483.36% |
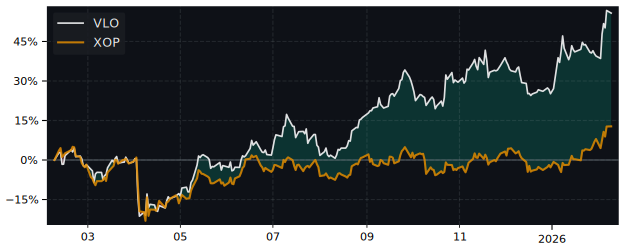
| VLO | 51.22% | 135.55% | 288.90% |
Performance: VLO vs S&P 500
| PERIOD | VLO | S&P 500 | DIFFERENCE |
|---|---|---|---|
| 1 Month | 7.04% | -3.48% | 10.90% |
| 3 Months | 36.00% | -4.38% | 42.23% |
| 6 Months | 51.22% | -1.79% | 53.99% |
| 12 Months | 135.55% | 31.52% | 79.10% |
| 5 Years | 288.90% | 72.80% | 125.06% |
VLO Performance FAQ
Does VLO outperform the market?
Yes, VLO significantly outperforms the market. Over the past 12 months, VLO returned 135.55% compared to 31.52% for the S&P 500.
What is the VLO return over the last 12 months?
VLO has returned 135.55% over the past 12 months, including dividends. Over 3 months the return was 36.00%, and over 5 years 288.90%.
How risky is VLO?
VLO has relatively low risk with a maximum drawdown of 41.22% over the past 3 years. The average drawdown is 14.56%.
VLO vs Sectors (12m)
Sorted by outperformance. Positive = VLO beats sector.
| SECTOR | ETF | DIFFERENCE 12M |
|---|---|---|
| Consumer Staples | XLP | 127% |
| Health Care | XLV | 124.4% |
| Real Estate | XLRE | 122.3% |
| Financials | XLF | 121.5% |
| Consumer Discretionary | XLY | 114.9% |
| Communication Services | XLC | 106.1% |
| Communication Services | XLC | 106.1% |
| Materials | XLB | 101.4% |
| Industrials | XLI | 94.2% |
| Technology | XLK | 86.5% |
| Energy | XLE | 79.3% |
VLO vs Asset Classes (12m)
| ASSET CLASS | ETF | DIFFERENCE 12M |
|---|---|---|
| S&P 500 | SPY | 79.10% |
| Gold | GLD | 78.7% |
| Long-Term Bonds | TLT | 134.8% |