BN Performance: 2.7% Return (12 Months)
BN returned 2.7% over 12 months, underperforming the S&P 500 (32.1%). Volatility: 20.2%.
RS IBD
-2.34
Top 47% in Peers
Volatility
20.2%
Top 6% in Peers
Total Return 12m
2.73%
Top 39% in Peers
RS Rating
27.26
Top 47% in Peers
P/E
| P/E Trailing | 24.6 |
| P/E Forward | 17.9 |
High / Low 52w
| 52 Week High | 79.60 EUR |
| 52 Week Low | 65.78 EUR |
Sentiment
| VRO Trend Strength ±100 | 32.79 |
| Buy Signal ±3 | -0.06 |
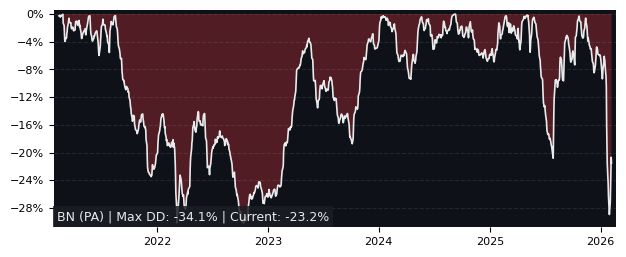
Drawdowns 3y
| Max Drawdown | 17.29% |
| Mean Drawdown | 4.20% |
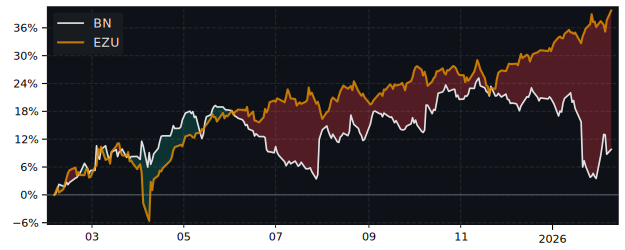
Compare performance with 38 peers in Packaged Foods & Meats
12m Total Return: BN (2.7%) vs PEER ETF
5y Drawdown (Underwater) Chart
Top Performer in Packaged Foods & Meats (5/38)
Short Term Performance
| SYMBOL | 1W | 1M | 3M |
|---|---|---|---|
| AGRO | -0.33% | 49.61% | 96.89% |
| SZU | 3.46% | 24.11% | 37.72% |
| JBS | 3.11% | 15.21% | 32.84% |
| SFD | 6.39% | 18.75% | 32.69% |
| WEST | 16.05% | 20.51% | 25.67% |
| BN | -0.09% | -1.37% | -7.78% |
Long Term Performance
| SYMBOL | 6M | 12M | 5Y |
|---|---|---|---|
| MAMA | 46.44% | 119.03% | 405.57% |
| SENEA | 38.81% | 86.25% | 205.72% |
| SFD | 28.43% | 56.23% | 52.67% |
| AGRO | 99.07% | 52.40% | 111.53% |
| JBS | 31.76% | 27.26% | 27.26% |
| BN | -4.23% | 2.73% | 36.12% |
Overall Best Picks of Peer Group (GARP Metrics)
| SYMBOL | MCAP | 1M | 12M | 5Y | P/E | P/E fwd | PEG | EPS stab | EPS cagr |
|---|---|---|---|---|---|---|---|---|---|
| JDEP AS Jde Peets |
17.8B | 0.25% | 67.6% | 15.2% | 19.8 | 15.6 | 1.21 | 2.70% | - |
| TR NYSE Tootsie Roll Industries |
3.19B | 4.53% | 50.9% | 64.9% | 32.9 | 26.7 | 3.43 | -6.80% | -40.6% |
| HSY NYSE Hershey |
41.8B | -7.56% | 31.8% | 46.5% | 47.6 | 24.8 | 1.18 | -47.3% | -9.92% |
| VIS MC Viscofan |
3.18B | 2.02% | -0.66% | 18.7% | 17.3 | 17.7 | 2.16 | 21.0% | 16.9% |
| BN PA Danone |
51.1B | -1.37% | 2.73% | 36.1% | 24.6 | 17.9 | 1.74 | -3.70% | -31.6% |
Performance: BN vs S&P 500
Total Return vs S&P 500
| PERIOD | BN | S&P 500 | DIFFERENCE |
|---|---|---|---|
| 1 Month | -1.37% | -1.73% | 0.85% |
| 3 Months | -7.78% | -4.49% | -2.98% |
| 6 Months | -4.23% | -1.33% | -2.48% |
| 12 Months | 2.73% | 32.14% | -21.89% |
| 5 Years | 36.12% | 72.70% | -20.81% |
BN Performance FAQ
Does BN outperform the market?
No, BN underperforms the market. Over the past 12 months, BN returned 2.73% compared to 32.14% for the S&P 500.
What is the BN return over the last 12 months?
BN has returned 2.73% over the past 12 months, including dividends. Over 3 months the return was -7.78%, and over 5 years 36.12%.
How risky is BN?
BN has relatively low risk with a maximum drawdown of 17.29% over the past 3 years. The average drawdown is 4.20%.
BN vs Sectors (12m)
Sorted by outperformance. Positive = BN beats sector.
Relative Performance vs S&P Sectors
| SECTOR | ETF | DIFFERENCE 12M |
|---|---|---|
| Consumer Staples | XLP | -6.8% |
| Health Care | XLV | -8% |
| Real Estate | XLRE | -10.9% |
| Financials | XLF | -12.2% |
| Consumer Discretionary | XLY | -19% |
| Consumer Discretionary | XLY | -19% |
| Communication Services | XLC | -26.8% |
| Materials | XLB | -30.9% |
| Industrials | XLI | -39.4% |
| Technology | XLK | -47.2% |
| Energy | XLE | -54.7% |
BN vs Asset Classes (12m)
Relative Performance vs Major Asset Classes
| ASSET CLASS | ETF | DIFFERENCE 12M |
|---|---|---|
| S&P 500 | SPY | -21.89% |
| Gold | GLD | -53.5% |
| Long-Term Bonds | TLT | 2.1% |