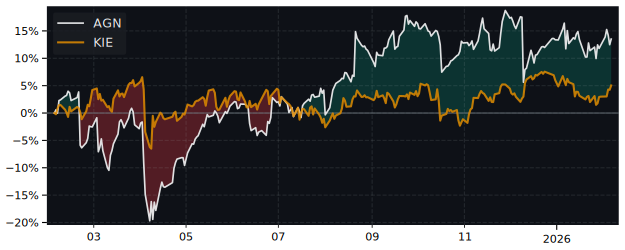
AGN Performance: 35.5% Return (12 Months)
AGN returned 35.5% over 12 months, in line with the S&P 500 (32.1%). Volatility: 25.8%.
| P/E Trailing | 10.6 |
| P/E Forward | 7.43 |
| 52 Week High | 6.95 EUR |
| 52 Week Low | 4.72 EUR |
| VRO Trend Strength ±100 | 65.41 |
| Buy Signal ±3 | 0.26 |
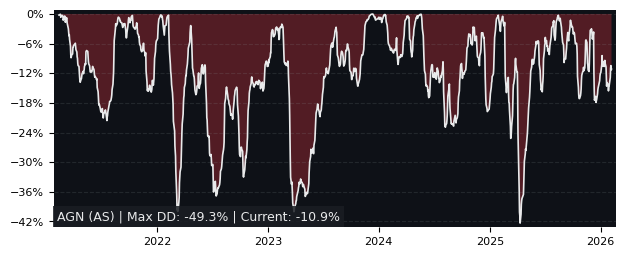
| Max Drawdown | 22.76% |
| Mean Drawdown | 4.50% |
Top Performer in Multi-line Insurance (5/15)
| SYMBOL | 1W | 1M | 3M |
|---|---|---|---|
| UNI | 4.52% | 7.53% | 0.59% |
| CS | 4.38% | 6.91% | -0.07% |
| G | 4.74% | 8.09% | -0.22% |
| ASRNL | 3.71% | 5.91% | -1.39% |
| TLX | 4.48% | 6.09% | -1.79% |
| AGN | 3.84% | 4.73% | -6.51% |
| SYMBOL | 6M | 12M | 5Y |
|---|---|---|---|
| UNI | 11.83% | 74.26% | 517.70% |
| MAP | -2.49% | 56.87% | 186.74% |
| ASRNL | 7.37% | 35.58% | 117.09% |
| AGN | -6.43% | 35.51% | 105.32% |
| L | 5.40% | 33.57% | 107.00% |
| G | 9.68% | 27.40% | 192.71% |
| SYMBOL | MCAP | 1M | 12M | 5Y | P/E | P/E fwd | PEG | EPS stab | EPS cagr |
|---|---|---|---|---|---|---|---|---|---|
| ASRNL AS ASR Nederland |
14.5B | 5.91% | 35.6% | 117% | 28.2 | 10.2 | - | -25.1% | -37.9% |
| MAP MC Mapfre |
14.5B | 7.06% | 56.9% | 187% | 11.8 | 8.88 | 2.59 | 40.7% | 11.4% |
Performance: AGN vs S&P 500
| PERIOD | AGN | S&P 500 | DIFFERENCE |
|---|---|---|---|
| 1 Month | 4.73% | -1.73% | 7.08% |
| 3 Months | -6.51% | -4.49% | -1.65% |
| 6 Months | -6.43% | -1.33% | -4.72% |
| 12 Months | 35.51% | 32.14% | 3.03% |
| 5 Years | 105.32% | 72.70% | 19.45% |
AGN Performance FAQ
Does AGN outperform the market?
Yes, AGN slightly outperforms the market. Over the past 12 months, AGN returned 35.51% compared to 32.14% for the S&P 500.
What is the AGN return over the last 12 months?
AGN has returned 35.51% over the past 12 months, including dividends. Over 3 months the return was -6.51%, and over 5 years 105.32%.
How risky is AGN?
AGN has relatively low risk with a maximum drawdown of 22.76% over the past 3 years. The average drawdown is 4.50%.
AGN vs Sectors (12m)
Sorted by outperformance. Positive = AGN beats sector.
| SECTOR | ETF | DIFFERENCE 12M |
|---|---|---|
| Consumer Staples | XLP | 26% |
| Health Care | XLV | 24.8% |
| Real Estate | XLRE | 21.9% |
| Financials | XLF | 20.6% |
| Consumer Discretionary | XLY | 13.8% |
| Consumer Discretionary | XLY | 13.8% |
| Communication Services | XLC | 6% |
| Materials | XLB | 1.9% |
| Industrials | XLI | -6.6% |
| Technology | XLK | -14.5% |
| Energy | XLE | -21.9% |
AGN vs Asset Classes (12m)
| ASSET CLASS | ETF | DIFFERENCE 12M |
|---|---|---|
| S&P 500 | SPY | 3.03% |
| Gold | GLD | -20.7% |
| Long-Term Bonds | TLT | 34.9% |