(FHYD) First Hydrogen - Performance 68% in 12m
FHYD performance: live returns, drawdowns, peer ranking & SPY comparison from 1w to 5y, all in one clean chart-driven dashboard.
Performance Rating
-22.72%
#22 in Peer-Group
Rel. Strength
90.85%
#697 in Stock-Universe
Total Return 12m
68.00%
#3 in Peer-Group
Total Return 5y
-13.10%
#23 in Peer-Group
| P/E | Value |
|---|---|
| P/E Trailing | - |
| P/E Forward | - |
| High / Low | CAD |
|---|---|
| 52 Week High | 1.33 CAD |
| 52 Week Low | 0.33 CAD |
| Sentiment | Value |
|---|---|
| VRO Trend Strength +-100 | 98.66 |
| Buy/Sell Signal +-5 | -0.73 |
| Support / Resistance | Levels |
|---|---|
| Support | |
| Resistance |
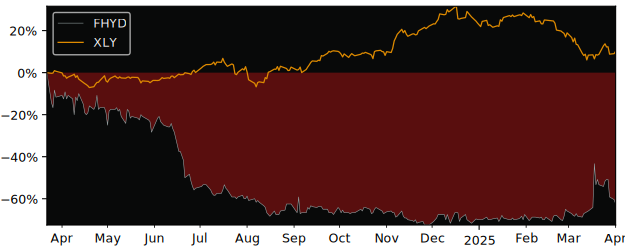
12m Total Return: FHYD (68%) vs VT (12.6%)
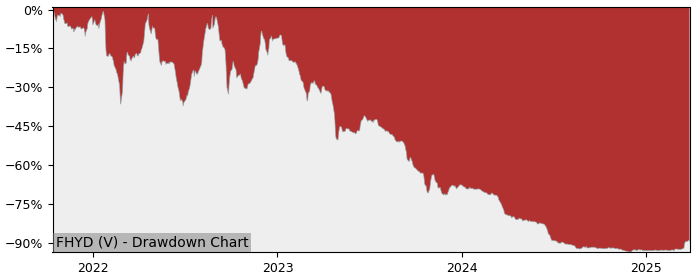
5y Drawdown (Underwater) Chart
Top Performer in Automobile Manufacturers
Overall best picks of Peer Group - Selected by proven GARP Predictive Metrics, sorted by Growth Rating
| Symbol | 1m | 12m | 5y | P/E | P/E Forward | PEG | EPS Stability | EPS CAGR |
|---|---|---|---|---|---|---|---|---|
| RNO PA Renault |
-11.8% | -7.26% | 116% | 15.9 | 6.82 | 0.81 | 20.8% | 58.2% |
| TM NYSE Toyota Motor |
-2.56% | -5.28% | 61.6% | 7.57 | 10.5 | 1.54 | 54.8% | 31.7% |
| LI NASDAQ Li Auto |
-2.77% | 50.5% | 68.7% | 27.6 | 19.5 | 1.24 | 77.7% | 129% |
| GM NYSE General Motors |
-2.62% | 3.72% | 80.8% | 6.83 | 5.23 | 1.49 | 65.5% | 9.55% |
| VOW3 XETRA Volkswagen VZO O.N. |
-8.77% | -9.94% | 4.91% | 4.93 | 4.3 | 0.78 | -48.3% | -20.6% |
| THO NYSE Thor Industries |
6.64% | -4.74% | -15.8% | 20.8 | 16.3 | 0.73 | -63.9% | -19% |
| VOW XETRA Volkswagen |
-8.84% | -15.3% | -7.99% | 5.02 | 4.37 | 0.79 | -47.7% | -20.6% |
Performance Comparison: FHYD vs VT vs S&P 500
VT (Vanguard Total World Stock ETF) is the Sector Benchmark for FHYD
| Total Return (including Dividends) | FHYD | VT | S&P 500 |
|---|---|---|---|
| 1 Month | 154.55% | 1.57% | 1.11% |
| 3 Months | 193.02% | 5.66% | 5.58% |
| 12 Months | 68.00% | 12.60% | 10.51% |
| 5 Years | -13.10% | 85.65% | 109.12% |
| Trend Score (consistency of price movement) | FHYD | VT | S&P 500 |
|---|---|---|---|
| 1 Month | 96.4% | 81.7% | 69.9% |
| 3 Months | 41.6% | 75.1% | 69.3% |
| 12 Months | 3.7% | 58.4% | 43.2% |
| 5 Years | -73.1% | 72.6% | 84.1% |
| Relative Strength (compared with Indexes) | Rank in Peer Group | vs. VT | vs. S&P 500 |
|---|---|---|---|
| 1 Month | #2 | 150.61% | 151.76% |
| 3 Month | #1 | 177.32% | 177.54% |
| 12 Month | #4 | 49.21% | 52.02% |
| 5 Years | #17 | -34.51% | -40.68% |
FAQs
Does First Hydrogen (FHYD) outperform the market?
Yes,
over the last 12 months FHYD made 68.00%, while its related Sector, the Vanguard Total World Stock (VT) made 12.60%.
Over the last 3 months FHYD made 193.02%, while VT made 5.66%.
Performance Comparison FHYD vs Indeces and Sectors
Above 0 means better perfomance compared to Symbol in this Timeframe
FHYD vs. Indices
| Symbol | 1w | 1m | 6m | 12m | |
|---|---|---|---|---|---|
| US S&P 500 | SPY | 59.9% | 153.4% | 216% | 57% |
| US NASDAQ 100 | QQQ | 60.2% | 153.1% | 216.8% | 59% |
| German DAX 40 | DAX | 62.2% | 155.3% | 199.7% | 39% |
| Shanghai Shenzhen CSI 300 | CSI 300 | 60.2% | 155.5% | 214.2% | 56% |
| Hongkong Hang Seng | HSI | 59.4% | 149.5% | 197% | 41% |
| India NIFTY 50 | INDA | 61.7% | 155.9% | 217% | 69% |
| Brasil Bovespa | EWZ | 57.6% | 154.1% | 195.8% | 59% |
FHYD vs. Sectors
| Symbol | 1w | 1m | 6m | 12m | |
|---|---|---|---|---|---|
| Communication Services | XLC | 60.3% | 153.1% | 213.2% | 45% |
| Consumer Discretionary | XLY | 60.5% | 156.4% | 225.9% | 50% |
| Consumer Staples | XLP | 60.3% | 154.8% | 214.5% | 61% |
| Energy | XLE | 54.1% | 151.6% | 212.4% | 65% |
| Financial | XLF | 61.5% | 157.1% | 213.2% | 44% |
| Health Care | XLV | 58% | 150.2% | 216.5% | 73% |
| Industrial | XLI | 61% | 154.2% | 210.5% | 50% |
| Materials | XLB | 60.6% | 153.2% | 215.2% | 69% |
| Real Estate | XLRE | 59.4% | 153.6% | 215% | 55% |
| Technology | XLK | 59.6% | 152.5% | 215.6% | 64% |
| Utilities | XLU | 58.6% | 154% | 207.7% | 47% |
| Aerospace & Defense | XAR | 60.9% | 148.8% | 199.1% | 25% |
| Biotech | XBI | 60.3% | 146.8% | 226.8% | 76% |
| Homebuilder | XHB | 61.6% | 159.6% | 231.4% | 77% |
| Retail | XRT | 63.9% | 154.7% | 224% | 67% |
FHYD vs. Commodities
| Symbol | 1w | 1m | 6m | 12m | |
|---|---|---|---|---|---|
| Oil | USO | 48.2% | 136% | 206% | 65% |
| Natural Gas | UNG | 60.7% | 157.2% | 197.7% | 83% |
| Gold | GLD | 56.3% | 148.4% | 185.8% | 21% |
| Silver | SLV | 60.8% | 143.2% | 196.4% | 46% |
| Copper | CPER | 62.5% | 152.8% | 201.1% | 60% |
FHYD vs. Bonds
| Symbol | 1w | 1m | 6m | 12m | |
|---|---|---|---|---|---|
| iShares 20+ Years Bond | TLT | 58.5% | 153.9% | 217.4% | 72% |
| iShares High Yield Corp. Bond | HYG | 59.5% | 154% | 212.3% | 59% |