SBUX Performance Analysis - Starbucks | 16.5% 12M Return
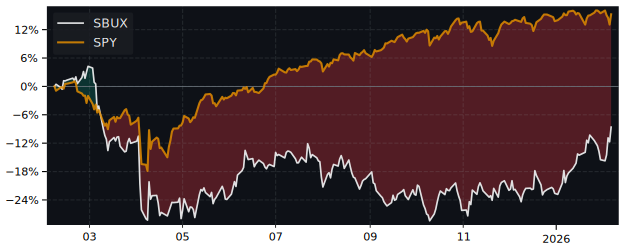
12M Return: 16.5% | -5.7% vs S&P 500 | Volatility: 26.4% | Relative Strength, Momentum & Peer Ranking
Detailed Performance Metrics Updated: 2026-07-13 03:55
| CAGR | 4.0% |
| CAGR / Max DD | 0.13 |
| CAGR / Mean DD | 0.27 |
| CAGR / Median DD | 0.29 |
| ATR % | 2.60% |
| Beta | 1.017 |
| Beta Downside | 1.000 |
| Alpha | -8.39% |
| CAPM | 9.56% |
| Current Price | 106.01 USD |
| SMA 20 Distance | -2.85% |
| SMA 50 Distance | -3.36% |
| SMA 200 Distance | -12.81% |
| RSI 14 | 60.7 |
| EMA8 Dist. Percentile | 69.3% |
| Distance to 52W High | -1.73% |
| Hurst Exponent | 0.475 |
| METRIC | SBUX | PERCENTILE RANK |
|---|---|---|
| RS IBD | 67.24 | 72.9 |
| Performance 1M | 2.88% | 52.9 |
| Performance 3M | 9.39% | 50.0 |
| Performance 6M | 19.30% | 84.3 |
| Performance 12M | 16.47% | 78.6 |
| Sharpe Ratio | 0.46 | 77.1 |
Top Performer in Restaurants 5 of 35 peers
| SYMBOL | 1W | 1M | 3M |
|---|---|---|---|
| CBRL | -5.76% | 7.99% | 81.04% |
| BJRI | 5.97% | 18.32% | 68.73% |
| CAKE | 4.52% | 9.94% | 41.21% |
| JACK | -13.43% | 11.37% | 30.84% |
| DASH | -0.10% | 27.39% | 20.18% |
| SBUX | 1.67% | 2.88% | 9.39% |
| SYMBOL | 6M | 12M | 5Y |
|---|---|---|---|
| LOCO | 48.40% | 54.31% | 2.92% |
| BJRI | 38.11% | 51.85% | 30.66% |
| ARMK | 50.10% | 34.13% | 142.34% |
| CAKE | 39.46% | 31.28% | 74.42% |
| SBUX | 19.30% | 16.47% | -0.35% |
| CBRL | 57.72% | -19.71% | -57.26% |
Overall Best Picks of Peer Group GARP Metrics
| SYMBOL | MCAP | 1M | 12M | 5Y | P/E | P/E fwd | PEG | EPS cagr |
|---|---|---|---|---|---|---|---|---|
| CAKE NASDAQ The Cheesecake Factory |
3.82B | 9.94% | 31.28% | 74.42% | 22.6 | 19.6 | 1.63 | 21.34% |
| YUM NYSE Yum! Brands |
45.8B | 5.98% | 13.27% | 53.41% | 26.8 | 25.2 | 2.04 | 6.69% |
| EAT NYSE Brinker International |
7.52B | 16.28% | 12.02% | 196.23% | 17.1 | 14.5 | 0.89 | 65.77% |
| QSR NYSE Restaurant Brands |
34.2B | 1.47% | 15.97% | 40.21% | 24.1 | 13.1 | 1.26 | 0.23% |
Compare SBUX vs S&P 500
| PERIOD | SBUX | S&P 500 |
|---|---|---|
| 1 Week | 1.67% | 1.37% |
| 1 Month | 2.88% | 2.04% |
| 3 Months | 9.39% | 10.32% |
| 6 Months | 19.30% | 9.18% |
| 12 Months | 16.47% | 22.17% |
| 5 Years | -0.35% | 85.44% |
FAQ
No, SBUX underperforms the market. Over the past 12 months, SBUX returned 16.47% compared to 22.17% for the S&P 500.
SBUX has returned 16.47% over the past 12 months, including dividends. Over 3 months the return was 9.39%, and over 5 years -0.35%.
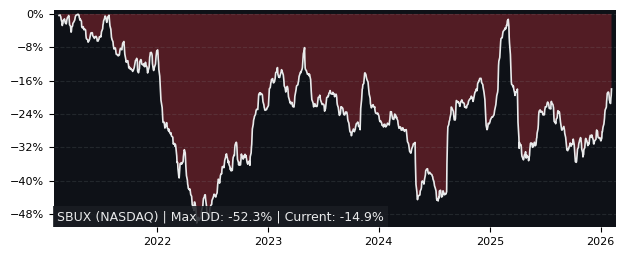
SBUX has relatively low risk with a maximum drawdown of 31.97% over the past 3 years. The average drawdown is 15.14%.
SBUX vs Sectors 12m
| SECTOR | ETF | DIFFERENCE 12M |
|---|---|---|
| Communication Services | XLC | 10.9% |
| Consumer Discretionary | XLY | 10.1% |
| Consumer Staples | XLP | 9.6% |
| Financials | XLF | 8.8% |
| Real Estate | XLRE | 6.6% |
| Real Estate | XLRE | 6.6% |
| Materials | XLB | 2.6% |
| Health Care | XLV | -4.7% |
| Industrials | XLI | -5.6% |
| Energy | XLE | -12.4% |
| Technology | XLK | -29.6% |
SBUX vs Asset Classes 12m
| ASSET CLASS | ETF | DIFFERENCE 12M |
|---|---|---|
| S&P 500 | SPY | -5.7% |
| Emerging Market | EEM | -24.7% |
| Gold | GLD | -5.9% |
| Long-Term Bonds | TLT | 13.3% |
| Risk-Free Cash | SHY | 13.5% |