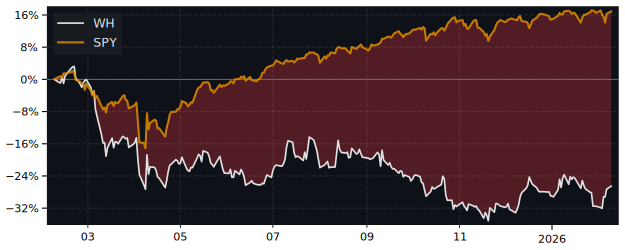
WH Performance: 4.2% Return (12 Months)
WH returned 4.2% over 12 months, underperforming the S&P 500 (32.2%). Volatility: 30.3%.
RS IBD
-12.86
Top 52% in Peers
Volatility
30.3%
Top 23% in Peers
Total Return 12m
4.17%
Top 81% in Peers
RS Rating
41.71
Top 52% in Peers
P/E
| P/E Trailing | 32.9 |
| P/E Forward | 16.8 |
High / Low 52w
| 52 Week High | 90.58 USD |
| 52 Week Low | 68.56 USD |
Sentiment
| VRO Trend Strength ±100 | 79.55 |
| Buy Signal ±3 | -0.17 |
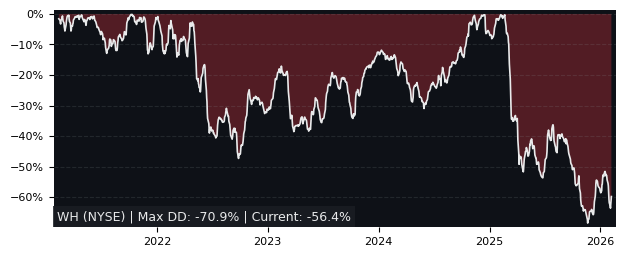
Drawdowns 3y
| Max Drawdown | 37.17% |
| Mean Drawdown | 12.32% |
Compare performance with 28 peers in Hotels, Resorts & Cruise Lines
12m Total Return: WH (4.2%) vs PEER ETF
5y Drawdown (Underwater) Chart
Top Performer in Hotels, Resorts & Cruise Lines (5/28)
Short Term Performance
| SYMBOL | 1W | 1M | 3M |
|---|---|---|---|
| TH | 47.95% | 73.80% | 70.98% |
| MEL | 3.34% | 26.96% | 23.55% |
| PRSU | 7.86% | 9.36% | 19.62% |
| LIND | -1.16% | -3.99% | 14.15% |
| WH | -0.02% | 7.10% | 5.05% |
| CHH | 0.28% | 5.78% | 2.04% |
Long Term Performance
| SYMBOL | 6M | 12M | 5Y |
|---|---|---|---|
| TH | 78.78% | 114.53% | 339.36% |
| LIND | 39.48% | 112.95% | -6.56% |
| VIK | 20.13% | 109.37% | 173.87% |
| HTHT | 35.92% | 68.62% | 4.87% |
| MEL | 31.17% | 68.48% | 58.57% |
| WH | 3.21% | 4.17% | 23.09% |
Overall Best Picks of Peer Group (GARP Metrics)
| SYMBOL | MCAP | 1M | 12M | 5Y | P/E | P/E fwd | PEG | EPS stab | EPS cagr |
|---|---|---|---|---|---|---|---|---|---|
| IHG NYSE InterContinental Hotels |
20.0B | -0.44% | 36.4% | 101% | 27.6 | 22.2 | 1.25 | -37.3% | -53.3% |
| EXPE NASDAQ Expedia |
27.6B | -7.14% | 61.7% | 29.5% | 23.0 | 11.8 | 0.80 | 7.10% | -35.7% |
| ATAT NASDAQ Atour Lifestyle Holdings |
5.04B | -1.85% | 41.5% | 191% | 21.6 | 20.0 | - | 67.6% | 98.7% |
Performance: WH vs S&P 500
Total Return vs S&P 500
| PERIOD | WH | S&P 500 | DIFFERENCE |
|---|---|---|---|
| 1 Month | 7.10% | -2.54% | 9.90% |
| 3 Months | 5.05% | -4.14% | 9.59% |
| 6 Months | 3.21% | -0.92% | 4.17% |
| 12 Months | 4.17% | 32.20% | -21.20% |
| 5 Years | 23.09% | 71.53% | -28.24% |
WH Performance FAQ
Does WH outperform the market?
No, WH underperforms the market. Over the past 12 months, WH returned 4.17% compared to 32.20% for the S&P 500.
What is the WH return over the last 12 months?
WH has returned 4.17% over the past 12 months, including dividends. Over 3 months the return was 5.05%, and over 5 years 23.09%.
How risky is WH?
WH has relatively low risk with a maximum drawdown of 37.17% over the past 3 years. The average drawdown is 12.32%.
WH vs Sectors (12m)
Sorted by outperformance. Positive = WH beats sector.
Relative Performance vs S&P Sectors
| SECTOR | ETF | DIFFERENCE 12M |
|---|---|---|
| Consumer Staples | XLP | -3.5% |
| Health Care | XLV | -6.8% |
| Real Estate | XLRE | -9.4% |
| Financials | XLF | -10.7% |
| Consumer Discretionary | XLY | -16.1% |
| Communication Services | XLC | -25.4% |
| Communication Services | XLC | -25.4% |
| Materials | XLB | -29.1% |
| Industrials | XLI | -37.7% |
| Technology | XLK | -46.5% |
| Energy | XLE | -54.5% |
WH vs Asset Classes (12m)
Relative Performance vs Major Asset Classes
| ASSET CLASS | ETF | DIFFERENCE 12M |
|---|---|---|
| S&P 500 | SPY | -21.20% |
| Gold | GLD | -53.6% |
| Long-Term Bonds | TLT | 3.6% |