(AREN) Arena Holdings - Performance 566.7% in 12m
Compare AREN with Indices, Sectors and Commodities and Bonds. Who performs better in which timeframe?
Performance Rating
-41.67%
#51 in Group
Rel. Strength
99.77%
#19 in Universe
Total Return 12m
566.67%
#1 in Group
Total Return 5y
-57.11%
#52 in Group
P/E -
(?) Percentile in Group
P/E Forward -
(?) Percentile in Group
PEG -
(?) Percentile in Group
FCF Yield -4.62%
23th Percentile in Group
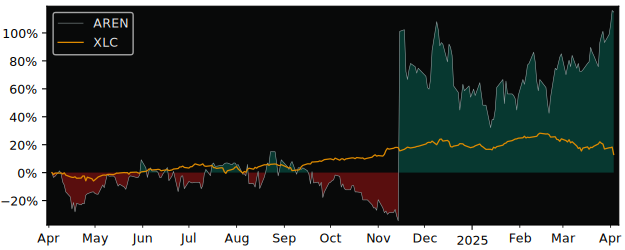
12m Total Return: AREN (566.7%) vs XLC (24%)
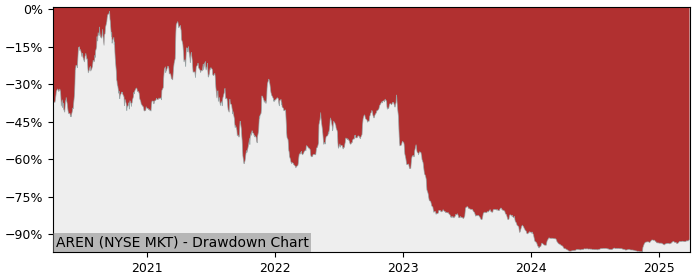
5y Drawdown (Underwater) Chart
Top Performers in Movies & Entertainment
Overall best picks of Peer Group Selected by proven GARP Predictive Metrics, sorted by Growth Rating
| Symbol | 1m | 12m | 5y | P/E | P/E Forward | PEG | EPS Stability |
EPS CAGR |
|---|---|---|---|---|---|---|---|---|
| NFLX NASDAQ Netflix |
21.4% | 106% | 164% | 52.5 | 44.3 | 1.97 | 74.1% | 58.1% |
| SPOT NYSE Spotify Technology |
11.6% | 119% | 323% | 100 | 56.2 | 1.48 | 62.0% | 339% |
| IMAX NYSE Imax |
-7.67% | 52% | 106% | 52.1 | 23 | 0.89 | 36.3% | -33.9% |
| CNK NYSE Cinemark Holdings |
20.2% | 75.1% | 119% | 14.4 | 18.2 | 1.82 | 71.3% | 29.5% |
| WMG NASDAQ Warner Music |
-2.87% | -5.67% | 10.8% | 31.2 | 20.5 | 1.13 | 48.7% | 118% |
| TME NYSE Tencent Music Entertainment |
-5.7% | 9.27% | 28.5% | 21.6 | 15.7 | 1.11 | 63.6% | 41.2% |
| DIS NYSE Walt Disney |
-7.85% | -17.4% | -10.8% | 29.2 | 16 | 0.86 | 26.6% | 119% |
| RSVR NASDAQ Reservoir Media |
-1.7% | -16.2% | -25.2% | 59.4 | 10.8 | 1.41 | -21.4% | 612% |
Performance Comparison: AREN vs XLC vs S&P 500
XLC (Communication Sector SPDR ETF) is the Sector Benchmark for AREN
| Total Return (including Dividends) | AREN | XLC | S&P 500 |
|---|---|---|---|
| 1 Month | 189.02% | -1.05% | -0.87% |
| 3 Months | 270.37% | -6.50% | -7.58% |
| 12 Months | 566.67% | 23.96% | 11.88% |
| 5 Years | -57.11% | 100.35% | 110.33% |
| Trend Score (consistency of price movement) | AREN | XLC | S&P 500 |
| 1 Month | 92.8% | 21.3% | 23% |
| 3 Months | 90.1% | -88.6% | -88.5% |
| 12 Months | 73.4% | 82.8% | 55.1% |
| 5 Years | -88.2% | 53% | 84.1% |
| Relative Strength (compared with Indexes) | Rank in Peer Group | vs. XLC | vs. S&P 500 |
| 1 Month | #3 | 192% | 192% |
| 3 Month | #1 | 296% | 301% |
| 12 Month | #2 | 438% | 496% |
| 5 Years | #53 | -78.6% | -79.6% |
FAQs
Does AREN Arena Holdings outperforms the market?
Yes,
over the last 12 months AREN made 566.67%, while its related Sector, the Communication Sector SPDR (XLC) made 23.96%.
Over the last 3 months AREN made 270.37%, while XLC made -6.50%.
Over the last 3 months AREN made 270.37%, while XLC made -6.50%.
Performance Comparison AREN vs Indeces and Sectors
AREN vs. Indices AREN is Over or Underperforming
| Symbol | 1w | 1m | 6m | 12m | |
|---|---|---|---|---|---|
| US S&P 500 | SPY | 45.2% | 190% | 689% | 555% |
| US NASDAQ 100 | QQQ | 44.2% | 188% | 688% | 554% |
| US Dow Jones Industrial 30 | DIA | 46.2% | 192% | 689% | 557% |
| German DAX 40 | DAX | 46.5% | 188% | 669% | 542% |
| Shanghai Shenzhen CSI 300 | CSI 300 | 49.2% | 192% | 692% | 561% |
| Hongkong Hang Seng | HSI | 46.2% | 189% | 687% | 553% |
| India NIFTY 50 | INDA | 48.1% | 185% | 688% | 564% |
| Brasil Bovespa | EWZ | 46.0% | 184% | 685% | 572% |
AREN vs. Sectors AREN is Over or Underperforming
| Symbol | 1w | 1m | 6m | 12m | |
|---|---|---|---|---|---|
| Communication Services | XLC | 45.0% | 190% | 683% | 543% |
| Consumer Discretionary | XLY | 45.2% | 189% | 686% | 553% |
| Consumer Staples | XLP | 48.7% | 189% | 683% | 555% |
| Energy | XLE | 49.7% | 203% | 695% | 578% |
| Financial | XLF | 46.6% | 191% | 681% | 544% |
| Health Care | XLV | 45.3% | 193% | 690% | 565% |
| Industrial | XLI | 44.8% | 189% | 688% | 557% |
| Materials | XLB | 45.9% | 191% | 696% | 570% |
| Real Estate | XLRE | 46.8% | 190% | 690% | 549% |
| Technology | XLK | 42.8% | 187% | 692% | 559% |
| Utilities | XLU | 48.1% | 189% | 687% | 545% |
| Aerospace & Defense | XAR | 44.3% | 183% | 675% | 540% |
| Biotech | XBI | 43.9% | 187% | 701% | 569% |
| Homebuilder | XHB | 45.9% | 191% | 704% | 574% |
| Retail | XRT | 46.8% | 190% | 694% | 569% |